Site Guide
Content
- Site Guide
- Criteria for analyzing and communicating earthquakes
- Criteria to visualize the events in the EARTHQUAKE LIST
- Earthquake origin time
- Epicenter location (latitude and longitude)
- Earthquake Depth
- Magnitude
- Region
- Municipalities within 20 km from the epicenter, and nearby Cities with at least 50,000 inhabitants
- ISTAT references
- Event Types
- Seismicity and Hazard
- Impact
- Time Domain Moment Tensor
- The Italian Seismic Bulletin
- StationXML
- QuakeML
- Privacy
- Open Data and Webservices
- License
Site Guide
As soon as an earthquake occurs, seismic waves (P and S) depart from the hypocenter and the resulting surface ground shaking is captured by the seismic stations of the Italian National Seismic Network. The recorded data are analyzed by the personnel on duty H24/7 in the INGV seismic surveillance center at the Rome headquarters of INGV. The earthquake location involves the determination of origin time, the geographic coordinates and depth. The size of the earthquake is determined by calculating the Richter magnitude (local magnitude ML).
For each earthquake, there is being created a web page that contains all the information available. These pages, however, can be adjourned as more information (e.g., data, more sophisticated analysis, …) become available. Other local, regional and national networks belonging to other Italian and foreign institutions also contribute to the location of the seismic events in realtime at the INGV seismic surveillance center.
The following sections describe and explain the various analysis products shown in the pages and the technical terms used.
Criteria for analyzing and communicating earthquakes
The INGV seismic surveillance center locates all earthquakes it has enough data to carry out the analysis successfully. According to the 2012-2021 framework program agreement between INGV and the Italian Civil Protection (DPC), INGV must provide all locations for magnitude ≥ 2.5 throughout the Italian borders. In addition, INGV must provide locations of earthquakes magnitude ≥ 5.0 within the Mediterranean area and di magnitude ≥ 6.0 globally. ( Accordo Quadro con il DPC ).
The parameters that define each earthquake are the origin time, the hypocenter (i.e., geographic coordinates and depth) and the magnitude. Other more complex parameters used by seismologists to describe the rupture process at the origin of the earthquake will be also presents these information pages.
Criteria to visualize the events in the EARTHQUAKE LIST
The pre-defined visualization of the Earthquake list shows all the seismic events with magnitude ≥ 2.0 that occurred in Italy in the last 7 days.
There are, however, some pre-defined alternative visualizations:
- Temporal windows of 7, 30, 90 and 365 days and since 2005-04-01.
- Magnitude minimum values of 2.0, 3.0, 4.0, 5.5, and any magnitude.
- Different geographic areas – Italy, Mediterranean, World.
- Italy: there are visualized all earthquakes within the following minimum and maximum geographical coordinates (35N, 6E), (48N, 27E) where the pairs of values correspond to (latitude, longitude).
- Mediterranean: all earthquakes withon the following minimum and maximum geographical coordinates (27N, 7W), (48N, 37.5E)
- World: all earthquakes worldwide.
As examples, if there are considered the “Criteria for analyzing and communicating earthquakes“ above and in the case there are selected Italy and any magnitude then there will be shown all seismic events within the national borders and bordering seas regardless their magnitude.
nalogously, in case there are selected Mediterranean and any magnitude, then there will be shown all the events located within the national national borders and bordering seas regardless their magnitude, all the earthquakes that occurred in other parts of the Mediterranean with magnitude ≥ 5.0. In order to perfect the visualization to the purpose of homogenizing the magnitudes throughout the area (i.e., restricting to only the larger events), it can be just increased the magnitude threshold to e.g. Magnitude 4+.
If there are selected World and any magnitude then there will be shown all seismic events within the national borders and bordering seas regardless their magnitude, all the earthquakes that occurred in other parts of the Mediterranean with magnitude ≥ 5.0 and all earthquakes with ≥ 6.0 in the rest of the world. Again and in order to improve the visualization, the magnitude threshold can be increased.
We note that if available there reported also earthquakes with lower magnitudes for the Mediterranean and the World.
Earthquake origin time
The origin time indicates the date and time at which start breaking along the fault plane. Note that large earthquakes can have rupture processes that last many tens of seconds. In the initial table of this website there is provided the origin time in Italian local time and in UTC (Coordinated Universal Time, the time zone of reference from which all other time zones in the world are calculated).
Seismologists use UTC to conform to a single measurement time and thus avoid confusion caused by local time zones and from daylight saving. On the pages of the individual events, there is also a time based on the time Italian origin, and the earthquakes that occur in time zones other than Italian is also referred to the local time at the epicenter.
The Italian local time is UTC +1 hour if it is during the winter time and UTC +2 hours when daylight saving time is in effect.
Epicenter location (latitude and longitude)
An earthquake begins to rupture the crust at the focus, defined as the point at depth where it begins the breaking of rocks or sliding on the fault and from which seismic waves start propagating in all directions. The hypocenter is defined by a position on the surface of the Earth (epicenter) and by a depth below this point (focal depth).
The coordinates of the epicenter are expressed in units of latitude and longitude. The latitude is the number of degrees north (N) or south (S) from the equator and ranges from 0 to 90 at the equator to the poles. Longitude is the number of degrees east (E) or West (W) from the prime meridian that runs through Greenwich, England. The longitude ranges from 0 (Greenwich) to +/- 180 depending on whether E or W of Greenwich, respectively. The coordinates are given in the WGS84 reference system.
Earthquake Depth
The depth of the hypocenter is the point at depth where it begins the breaking of rocks or the sliding on the fault. This depth is relative to mean sea level. Sometimes, when the depth is poorly constrained by the available seismic data, the seismologist in seismic surveillance center sets the depth to a fixed value. For example, 10 km is often used as a default depth for earthquakes that are thought to be superficial, when the depth can not be calculated in a satisfactory manner by the data.
Magnitude
Seismologists indicate the size of an earthquake in units of magnitude. There are many and different ways in which magnitude can be measured from seismograms. Each method works only on a limited interval of magnitude and epicentral distances, and types of data (e.g. types of seismometers). Some methods are based on volume waves (traveling deep within the structure of the Earth), some based on surface waves (traveling mostly along the surface layers of the Earth) and some based on completely different methods. However, all the methods are designed to link up well beyond the range of magnitude which are reliable.
In daily operation, preliminary values of magnitude, based on the incomplete data available after only a few tens of seconds from earthquake occurrence are reported to the Civil Protection Department and reported on web. These preliminary values of magnitude, which may differ from the final magnitude considerably (sometime up to 0.5 m.u.) are sufficient to the purposes of civil protection and are replaced by more accurate estimates of magnitude as soon as more information becomes available. In most cases, the first estimate of the magnitude provided by INGV seismic surveillance observatory in Rome is the Richter local magnitude ML. For events with a magnitude greater than about 3.5, if data are available, we calculate the focal mechanism with the technique of Time Domain Moment Tensor (TDMT, /tdmt) to obtain estimates of the Moment magnitude Mw.
The magnitude of the earthquake is a logarithmic measure of earthquake size. In simple terms, this means that at the same distance from the earthquake, the shaking will be 10 times larger than for an earthquake of magnitude 5 of that caused by an earthquake of magnitude 4. The total amount of energy released by the earthquake, however, increases 32 times for each unit of magnitude.
Region
In the table and in the Event Data page there is shown the Italian municipality or the area where the earthquake occurred. This information is obtained by taking the Italian municipality of the City where the epicenter falls on the basis of Istat. The zones are areas in the sea very close to the coast, the border areas and all locations outside the national territory. The areas have been defined in a database created specifically by INGV.
For the rest of the world are used the following regionalizations:
- Flinn-Engdahl http://earthquake.usgs.gov/learn/topics/flinn_engdahl.php
- Countries in the world 1:10m version 2.0.0 http://www.naturalearthdata.com/downloads/10m-cultural-vectors/
- Marine and land zones: the union of world country boundaries and EEZ version 1 - 2012 http://www.marineregions.org/downloads.php
Municipalities within 20 km from the epicenter, and nearby Cities with at least 50,000 inhabitants
In the Event Data page there are listed the municipalities, whose town hall is up to 20 km from the epicenter; Also are shown the province, the distance from the epicenter and the number of inhabitants on the basis of Istat.
Similarly, there are also shown the closest cities with at least 50,000 inhabitants that are located up to 100 km from the epicenter. They are given the distance and direction of the epicenter of the earthquake than the city. These distances are calculated from the Town Hall of the city and may have errors either because of uncertainty of the epicentral location (typically one or more kilometers) is due to the inability to describe the position of a city with a single value of longitude and latitude.
ISTAT references
Geographic coordinates and population of Italian municipalities published by ISTAT:
- Italian municipalities update by ISTAT to 2016 http://www.istat.it/it/archivio/6789
- Population of Italian municipalities update by ISTAT to 2016 http://demo.istat.it/pop2016/index3.html
Event Types
- earthquake
- not reported
- anthropogenic event
- collapse
- cavity collapse
- mine collapse
- building collapse
- explosion
- accidental explosion
- chemical explosion
- controlled explosion
- experimental explosion
- industrial explosion
- mining explosion
- quarry blast
- road cut
- blasting levee
- nuclear explosion
- induced or triggered event
- rock burst
- reservoir loading
- fluid injection
- fluid extraction
- crash
- plane crash
- train crash
- boat crash
- other event
- atmospheric event
- sonic boom
- sonic blast
- acoustic noise
- thunder
- avalanche
- snow avalanche
- debris avalanche
- hydroacoustic event
- ice quake
- slide
- landslide
- rockslide
- meteorite
- volcanic eruption
- not existing
- testing
Seismicity and Hazard
These maps show the seismicity for different time windows. The earthquake locations reported in these maps are determined in quasi real-time by the personnel on duty in the seismic surveillance center of INGV in Rome. Note that the earthquake source parameters (hypocentral location and magnitude) are the best estimates obstained with the available data and they are adjourned as additional data become available. The source parameters obtained by the personnel on duty are then revised by the group in charge of the INGV Seismic Bulletin (Bollettino Sismico Italiano dell’INGV).
Earthquakes of the last three days (72 hours). This map reports the earthquake epicenters located in the past 72 hours (3 days) from the time this page has been generated. The radius of the circle representing the earthquake on the map scales with magnitude. The color depends on the time of occurrence of the earthquakes with respect to the time of generation of the map (red = 1 hour; orange = 24 hours; yellow = 72 hours). The open star shows the epicenter of the current earthquake.
Earthquakes of the last 90 days. This map reports the Magnitudo ≥ 2.5 earthquake epicenters located using the data acquired by the Italian National Seismic Network and by other collaborating networks in Italy and in the neighbouring countries. The radii of the circles representing the epicenters on the map scale with magnitude. The color of each circle depends on the time of occurrence of the earthquakes with respect to the time of generation of the map (red = 1 hour; orange = 24 hours; yellow = 72 hours; blue = all other earthquakes). The open star shows the epicenter of the current earthquake.
Earthquakes since 1985. This map reports the Magnitudo ≥ 1.0 earthquake epicenters located using the data acquired by the Italian National Seismic Network and by other collaborating networks in Italy and in the neighbouring countries. The radii of the circles representing the epicenters on the map scale with magnitude. The color of each circle depends on the time of occurrence of the earthquakes with respect to the time of generation of the map (red = 1 hour; orange = 24 hours; yellow = 72 hours; blue = all other earthquakes). The open star shows the epicenter of the current earthquake.
This map shows the seismic hazard map of Italy for the region where the earthquake occurred.
Seismic hazard maps provide probabilistic estimates of the earthquake ground shaking exceeding a given threshold in a given geographic region within a given time window. Thus, it is not a deterministic prediction - a target that may be never reached given the complexity of the earthquake physical phenomenon - nor of the maximum expected earthquake since this has extremely low probabilities to occur.
In 2004, it was published the seismic hazard map of Italy (http://zonesismiche.mi.ingv.it) that provides a picture of the most hazardous geographic regions. The seismic hazard map of Italy (GdL MPS, 2004; rif. Ordinanza PCM del 28 aprile 2006, n. 3519, All. 1b) provides the 10% probability of exceedance in 50 years of the horizontal acceleration at rock sites (i.e., Vs30>800 m/s; cat. A, 3.2.1 of the D.M. 14.09.2005).
The colours indicate the various values of the ground acceleration that have 10% to be exceeded within 50 years. In general, the colours associated to low values of acceleration refer to areas that are less hazardous and stronger earthquakes repeat less frequently although they may still occur.
Impact
The earthquake effects in MCS scale as obtained from the compiled questionnaire. This map shows the distribution of the effects of the earthquake on the territory in terms of the MCS (Mercalli-Cancani-Sieberg) intensity scale. The intensities are determined using the data provided in the questionnaire (http://www.haisentitoilterremoto.it/) that are analysed using robust statistical techniques since they are not verified individually. Specifically, the assignment of MCS intensities greater or equal the VI degree of the MCS scale require opportune in situ verification by professional experts.
The purple start shows the epicenter. This map is prepared every so often that the population fill in new questionnaires. The number of questionnaires used to determine the map and the date and time of the last adjournment are shown in the upper right part of the panel.
These three maps show the results of the analysis using the software ShakeMap designed to provide the level of ground shaking experienced in a region using the data recorded by seismometers and strong motion instruments and seismological information regarding the attenuation of the wavefield with distance and the site characteristics. The Shakemaps are determined for research purposes to provide fast estimates of the level of ground shaking produced by the earthquake. The maps are calculated automatically and adjourned progressively as more data become available. See https://shakemap.ingv.it/ for additional information.
The red star indicates the epicenter. The red triangles show the stations of the INGV Italian National Seismic Network and the blue triangles those of the Nationa Accelerometric Network of the Dipartimento della Protezione Civile.
Intensity ShakeMap. This map shows the distribution of the istrumentally derived intensities. To this purpose, it is used a conversion relation between ground acceleration and velocity, and the Mercalli Modificata (MMI - Modified Mercalli Intensity) scale. In general, the Mercalli intensity scale relies on the effects that the ground shaking produces as reported by an observer.
Peak ground acceleration Shakemap. This map shows This map shows the distribution of peak ground acceleration expressed as per cent of the acceleration of gravity (i.e., g = 9.81 m/s².
Peak velocity Shakemap. This map shows the distribution of peak ground velocities expressed in cm/s.
Time Domain Moment Tensor
The Istituto Nazionale di Geofisica e Vulcanologia (INGV) routinely determines moment tensors for events with ML >= 3.5 occurring in Italy and in the neighbouring countries. The solutions are automatically obtained through the Time Domain Moment Tensor technique developed at U.C. Berkeley (see http://seismo.berkeley.edu/~dreger/mtindex.html) within 6-9 minutes after the occurrence of an earthquake. The algorithm inverts local to regional three-component broadband velocity waveforms to estimate a point-source solution. Analysts review the automatic solutions and post the results on this web-site.
Velocity model
Synthetic seismograms used in the moment tensors computation are calculated by using 1D laterally homogeneous layered velocity structures regionally calibrated.
CIA velocity model
CIA VELOCITY MODEL has been obtained integrating deep seismic reflection crustal profiles, surface-wave dispersion and teleseismic P-wave receiver functions in Central Apennine [Herrmann et al. (2011)].
Beachball plot
Beachball representation is plotted with Lambert projection by using the MoPaD software tool (Krieger L. and Heimann S., Seismol. Res. Lett., 83(3):589-595, 2012).
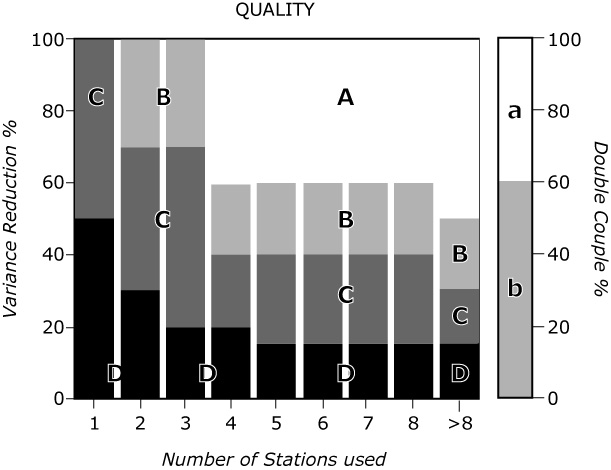
TDMT quality
The table illustrates how the solution quality (Q) is obtained. Q is based on the variance reduction, that measure the goodness of fit between data and synthetic, on the percentage of double couple and the number of inverted stations.
References
- Scognamiglio L., E. Tinti, and A. Michelini, (2009). Real-time determination of seismic moment tensor for italian region, Bull. Seism. Soc. of Am., Vol. 99, No. 4, pp. 2223-2242, doi:10.1785/0120080104.
- Scognamiglio L., E. Tinti, A. Michelini, D. S. Dreger, A. Cirella, M. Cocco, S. Mazza and A. Piatanesi (2010). Fast determination of moment tensors and rupture history: what has been learned from the 6 april 2009 l'aquila earthquake sequence. Seismological Research Letters, Vol. 81.No. 6, pp. 892-906 doi: 10.1785/gssrl.81.6.892.
- Scognamiglio L., L. Margheriti, F. M. Mele, E. Tinti, A. Bono, P. De Gori, V. Lauciani, F. P. Lucente, A. G. Mandiello, C. Marcocci, S. Mazza, S. Pintore, M. Quintiliani, (2012). The 2012 pianura padana emiliana seimic sequence: locations, moment tensors and magnitudes. Annals of Geophysics, 55, 4, doi: 10.4401/ag-6159.
- Dreger, D. S., L. Gee, P. Lombard, M. H. Murray, and B. Romanowicz (2005). Rapid finite-source analysis and near-fault strong ground motions: Application to the 2003 Mw 6.5 San Simeon and 2004 Mw 6.0 Parkfield earthquakes. Seismological Research Letters 76 (1), 40–48.
- Dreger, D. S., 2003,TDMT_INV: Time Domain Seismic Moment Tensor INVersion, International Handbook of Earthquake and Engineering Seismology, Volume 81B, p 1627.
- Herrmann, R.B., L. Malagnini, and I. Munafò (2011), Regional moment tensor of the 2009 L’Aquila earthquake sequence, Bull. Seismol. Soc. Am., 101 (3), 975-993, doi:10.1785/0120100184
- Dreger, D. S., and D. V. Helmberger (1993), Determination of Source Parameters at Regional Distances with Single S tation or Sparse Network Data, Journ. Geophys. Res., 98, 8107-8125.
- Krieger, L., and S. Heimann (2012). MoPaD - Moment Tensor Plotting andDecomposition: A Tool for Graphical and Numerical Analysis of Seismic Moment Tensors. Seismological Research Letters. Electronic Seismologist, May/June 2012 v. 83 no. 3 589-595. http://www.seismosoc.org/publications/SRL/SRL_83/srl_83-3_es_I/
The Italian Seismic Bulletin
Analysts of the Italian Seismic Bulletin double check the parameters of all earthquakes with magnitude M1.5+ obtained by placing weights and polarity of arrivals of seismic waves and integrating all the data available in the acquisition system.
Since 1985 the data of the Italian Seismic Bulletin are available in the database ISIDe /en/iside. For the period from January 2002 to 16 April 2005, these data, in GSE format, can also be found on http://bollettinosismico.rm.ingv.it/.
Starting from 2015 in the web page /en/bsi the Italian Seismic Bulletin (BSI) is published every 4 months and is available for download QuakeML format. For each release of the BSI, is also possible to download a technical document (in Italian, pdf format) which describes the main features of the Italian seismicity and seismic network and specifies the BSI working group. A DOI is assigned to each BSI release to make easily quotable the work done by the BSI group.
StationXML
The purpose of the FDSN StationXML schema is to define an XML representation of the most important and commonly used structures of SEED 2.4 metadata.
The goal is to allow mapping between SEED 2.4 dataless SEED volumes and this schema with as little transformation or loss of information as possible while at the same time simplifying station metadata representation when possible. Also, content and clarification has been added where lacking in the SEED standard.
When definitions and usage are underdefined the SEED manual should be referred to for clarification.
Another goal is to create a base schema that can be extended to represent similar data types.
More details and information at http://www.fdsn.org/xml/station/
QuakeML
QuakeML is a flexible, extensible and modular XML representation of seismological data which is intended to cover a broad range of fields of application in modern seismology.
QuakeML is an open standard and is developed by a distributed team in a transparent collaborative manner. QuakeML initially (until version 1.2) covered (only) a basic seismic event description, including moment tensors.
The flexible approach of QuakeML allows further extensions of the standard in order to represent waveform data, macroseismic information, probability density functions, slip distributions, shake maps, and others.
More details and information at https://quake.ethz.ch/quakeml
Privacy
Privacy Policy INGV http://www.ingv.it/en/privacy.html
Privacy and Cookies
This website uses cookies, text files on your computer, tablet, smartphone ant notebook to collect and compile anonymous, aggregated information for statistical and evaluation purposes to help us understand how users use the website and help us improve the structure of our website. Without use of cookies some operations could be not executed.
Website / uses:
- analytics cookies, per raccogliere ed elaborare i vostri dati di navigazione, tra cui gli indirizzi IP dei computer che si connettono al sito, gli indirizzi in notazione URI delle risorse richieste, l’orario della richiesta, la dimensione del file ottenuto in risposta; i dati sono raccolti al solo scopo di elaborare informazioni statistiche anonime sull’uso del sito e per verificare il corretto funzionamento dello stesso;
- cookies for managing data put by html form.
Privacy and Goole Analytics
This website uses Google Analytics to help analyse how users use the site.
The tool uses "cookies," which are text files placed on your computer, to collect standard Internet log information and visitor behaviour information in an anonymous form.
The information generated by the cookie about your use of the website (including your IP address) is transmitted to Google. This information is then used to evaluate visitors' use of this website and to compile statistical reports on website activity.
We will never (and will not allow any third party to) use the statistical analytics tool to track or to collect any Personally Identifiable Information of visitors to our site. Google will not associate your IP address with any other data held by Google. Neither we nor Google will link, or seek to link, an IP address with the identity of a computer user.
You may refuse the use of cookies by selecting the appropriate settings on your browser, however please note that if you do this you may not be able to use the full functionality of this website.
By using this website, you consent to the processing of data about you by Google in the manner and for the purposes set out above.
Open Data and Webservices
The most important data on earthquakes can be accessed via an open, machine-readable interface (webservices / XML format).
For more information visit the following page /webservices_and_software/
License
Data and results published on this website by Istituto Nazionale di Geofisica e Vulcanologia are licensed under a Creative Commons Attribution 4.0 International License. Based on a work at National Earthquake Observatory.
