Earthquake with magnitude of ML 3.8 on date 14-12-2017 and time 02:13:45 (Italy) in region Costa Ragusana (Ragusa)
A magnitude ML 3.8 earthquake occured in region: Costa Ragusana (Ragusa), on
- 14-12-2017 01:13:45 (UTC)
- 14-12-2017 02:13:45 (UTC +01:00) Italian time
and geographic coordinates (lat, lon) 36.4360, 14.6470 at 15 km depth.
The earthquake was located by: Bollettino Sismico Italiano INGV.
Search earthquakes: Any within 30 km radius
The values of hypocentral coordinates and magnitude may be revised at a later time as more information becomes available.
Municipalities within 20 km from the epicenter
No Italian municipalities within 20 km distance.
Municipalities with at least 50000 inhabitants
These maps show the seismic activity in different time intervals, before the seismic event to which they refer. Data reported in the first two maps come from the analysis carried out in real time by the personnel of the INGV Operating Rooms, immediately after each earthquake. The third map shows data from 1985 to the date of the earthquake: the locations are reviewed by the seismological analysts of the INGV Italian Seismic Bulletin (Bollettino Sismico Italiano dell’INGV). The localization parameters (hypocentral coordinates and magnitude) are the best possible estimate with the data available to the INGV, but are constantly updated according to further data that become available. The location and magnitude parameters, subsequently reviewed by seismological analysts, may vary.
Earthquakes of the 3 days preceding this event
Earthquakes of the 90 days preceding this event
Earthquakes from 1985 to the date of the event
Earthquakes since 1000 AD until 2019
Seismic hazard maps provide probabilistic estimates of the earthquake ground shaking exceeding a given threshold in a given geographic region within a given time window. Thus, it is not a deterministic prediction - a target that may be never reached given the complexity of the earthquake physical phenomenon - nor of the maximum expected earthquake since this has extremely low probabilities to occur.
In 2004, it was published the seismic hazard map of Italy (http://zonesismiche.mi.ingv.it) that provides a picture of the most hazardous geographic regions. The seismic hazard map of Italy (GdL MPS, 2004; rif. Ordinanza PCM del 28 aprile 2006, n. 3519, All. 1b) provides the 10% probability of exceedance in 50 years of the horizontal acceleration at rock sites (i.e., Vs30>800 m/s; cat. A, 3.2.1 of the D.M. 14.09.2005).
The colours indicate the various values of the ground acceleration that have 10% to be exceeded within 50 years. In general, the colours associated to low values of acceleration refer to areas that are less hazardous and stronger earthquakes repeat less frequently although they may still occur.
Seismic hazard map
These three maps show the results of the analysis using the software ShakeMap designed to provide the level of ground shaking experienced in a region using the data recorded by seismometers and strong motion instruments and seismological information regarding the attenuation of the wavefield with distance and the site characteristics. The Shakemaps are determined for research purposes to provide fast estimates of the level of ground shaking produced by the earthquake. The maps are calculated automatically and updated as more data become available. See http://shakemap.ingv.it for additional information. The black star indicates the epicenter. The triangles show the accelerometric and velocimetric stations used in the calculation, colored according to the recorded shaking.
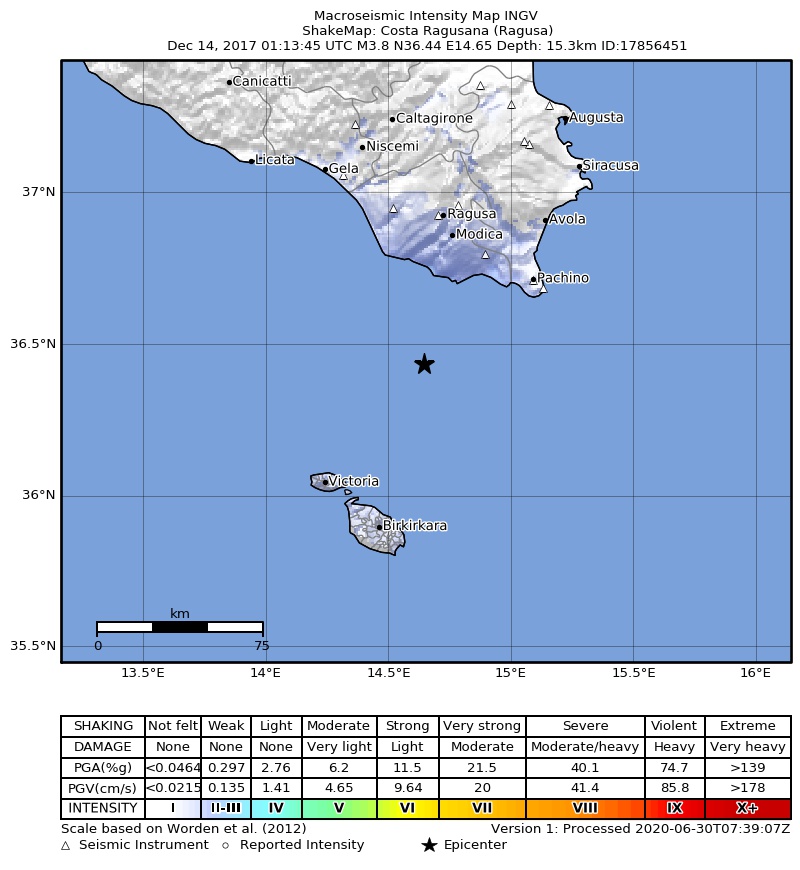
Intensity Shakemap
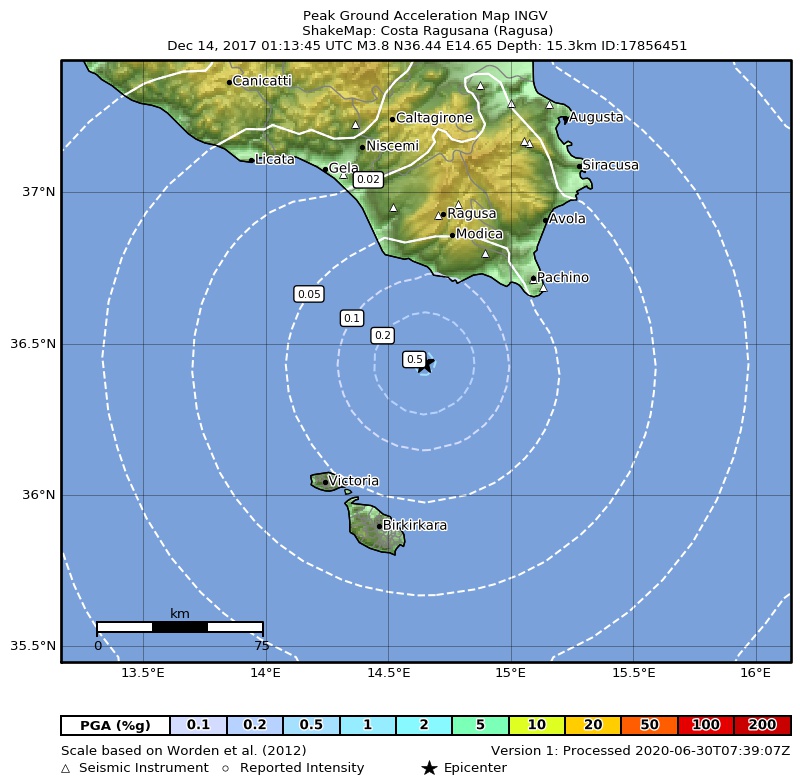
Peak ground acceleration Shakemap
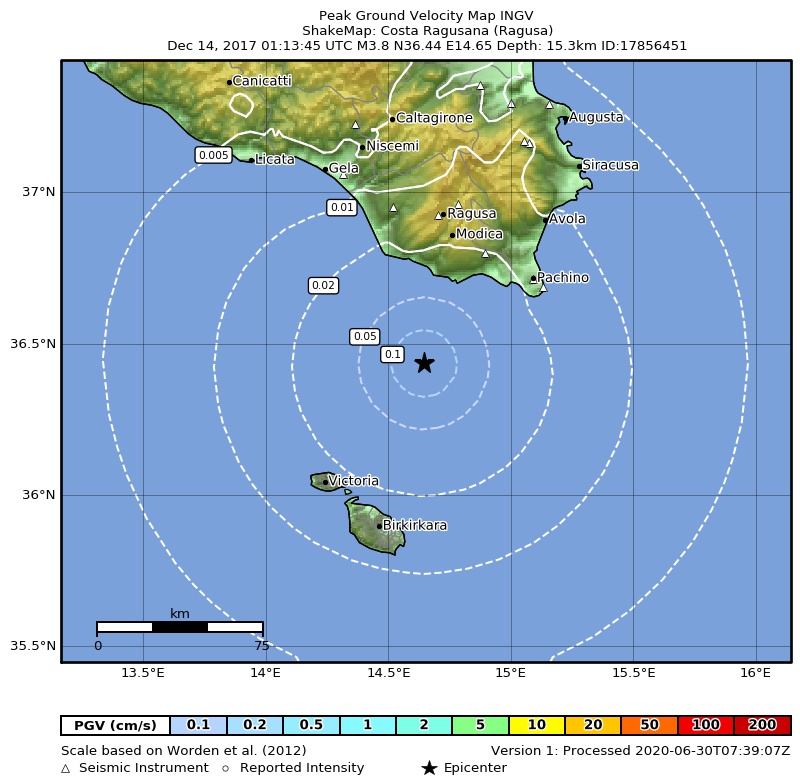
Peak velocity Shakemap
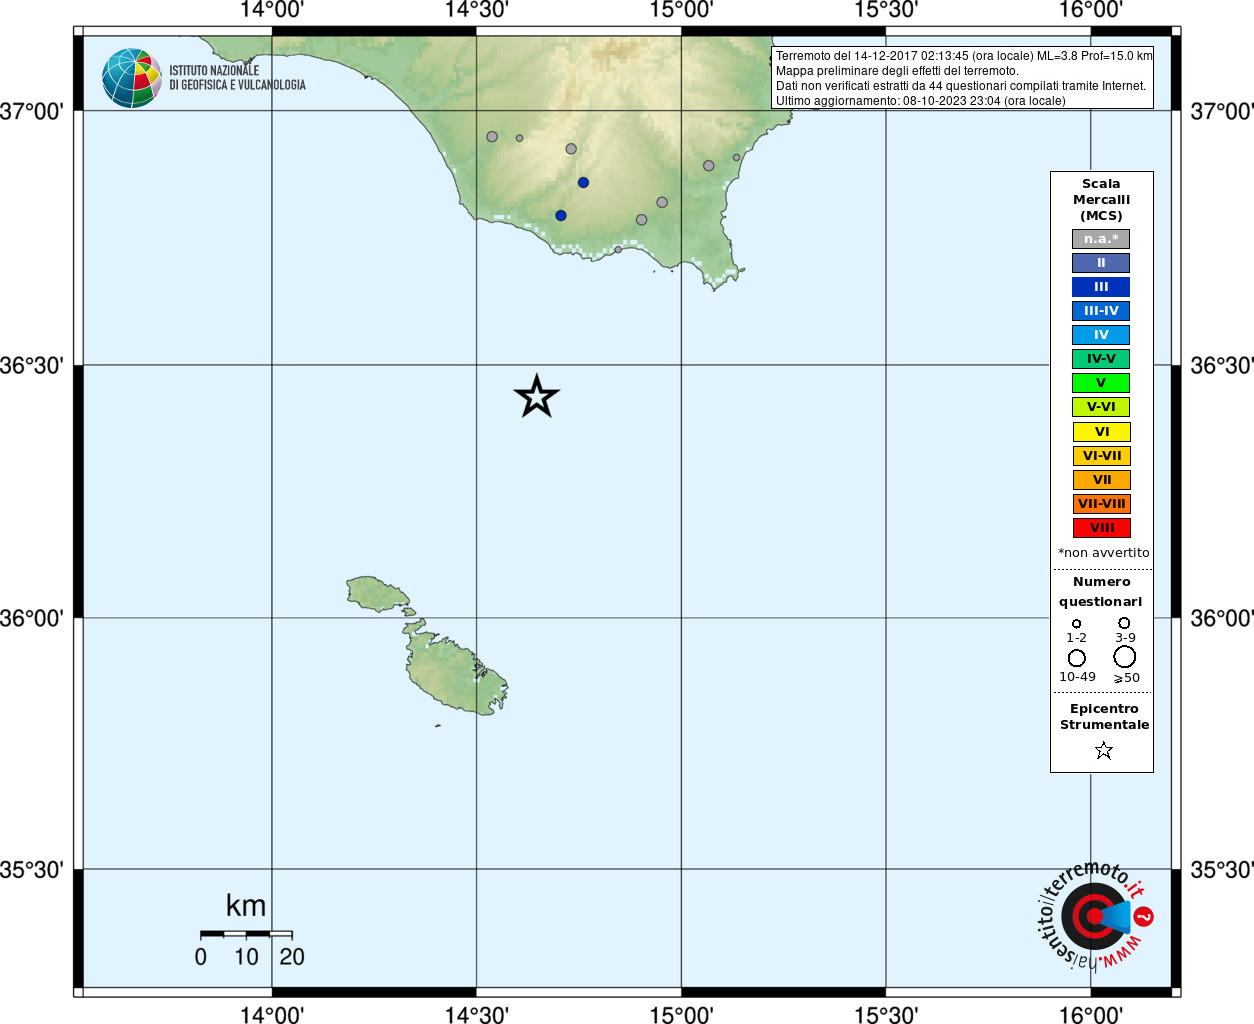
Preliminary map of the earthquake effects from the web questionnaire
| Type | Magnitude | Date and Time (UTC) | Latitude | Longitude | Depth (km) | Published time (UTC) | Author | Location ID |
|---|---|---|---|---|---|---|---|---|
|
Bulletin Rev1000 |
ML 3.8 | 2017-12-14 01:13:45 |
36.4362 | 14.6468 | 15 | 2017-12-17 08:03:29 |
Bollettino Sismico Italiano INGV | 52590061 |
|
Reviewed Rev100 |
ML 3.9 | 2017-12-14 01:13:43 |
36.2953 | 14.752 | 10 | 2017-12-14 01:27:33 |
Sala Sismica INGV-Roma | 52578171 |
Origin
| Field | Value |
|---|---|
| Time (UTC) | 2017-12-14 01:13:45 ± 0.32 |
| Latitude | 36.4362 ± 0.0180 |
| Longitude | 14.6468 ± 0.0179 |
| Depth (km) | 15 ± 2 (from location) |
| Evaluation mode of Origin | manual |
| Evaluation status of Origin | reviewed |
| Version | 1000 -> BULLETIN-INGV |
| Event type | earthquake |
| Origin ID | 52590061 |
Uncertainty
| Field | Value |
|---|---|
| Preferred uncertainty description | uncertainty ellipse |
| Semi-major axis of confidence ellipse (meter) | 1896 |
| Semi-minor axis of confidence ellipse (meter) | 1457 |
| Azimuth of major axis of confidence ellipse. Measured clockwise from South-North direction at epicenter (gradi) | 133 |
| Circular confidence region, given by single value of horizontal uncertainty (meter) | 1900.0 |
| Confidence level of the uncertainty (%) | 68 |
Quality
| Field | Value |
|---|---|
| Largest azimuthal gap in station distribution as seen from epicenter (degree) | 192 |
| Number of associated phases, regardless of their use for origin computation | 42 |
| Number of defining phases | 42 |
| RMS of the travel time residuals of the arrivals used for the origin computation (sec) | 0.41 |
| Epicentral distance of station closest to the epicenter (degree) | 0.41459 |
| Epicentral distance of station farthest from the epicenter (degree) | 2.46324 |
| Number of stations at which the event was observed | 36 |
| Number of stations from which data was used for origin computation | 36 |
ML:3.8
| Field | Value |
|---|---|
| Value | 3.8 |
| Uncertainty | 0.3 |
| Num. used stations | 38 |
| Type of magnitude | ML |
| Reference to an origin | 52590061 |
| Agency | INGV |
| Autore | Bollettino Sismico Italiano INGV |
| Time of creation (UTC) | 2017-12-16 09:49:36 |
ML:3.9
| Field | Value |
|---|---|
| Value | 3.9 |
| Uncertainty | 0.3 |
| Num. used stations | 38 |
| Type of magnitude | ML |
| Reference to an origin | 52578171 |
| Agency | INGV |
| Autore | Sala Sismica INGV-Roma |
| Time of creation (UTC) | 2017-12-14 01:27:33 |
| SCNL | Time | Uncertainty | Polarity | Evaluation_mode | Phase | Azimuth | Distance(km) | Takeoff_angle | Residual | Weight |
|---|---|---|---|---|---|---|---|---|---|---|
| IV.PLAC.HHE. | 2017-12-14T01:14:25.76 | 0.3 | undecidable | manual | P | 35 | 273.4152 | 54 | -0.05 | 28 |
| IV.JOPP.HNN. | 2017-12-14T01:14:24.48 | 0.6 | undecidable | manual | P | 24 | 264.3354 | 54 | -0.2 | 20 |
| IV.MARS.EHE. | 2017-12-14T01:14:20.73 | 0.6 | undecidable | manual | P | 309 | 235.1868 | 54 | -0.32 | 24 |
| MN.CEL.HNZ. | 2017-12-14T01:14:20.11 | 0.6 | undecidable | manual | P | 28 | 230.2917 | 54 | -0.34 | 25 |
| IV.CRJA.HHZ. | 2017-12-14T01:14:18.33 | 0.6 | undecidable | manual | P | 317 | 209.9343 | 54 | 0.42 | 28 |
| IV.MSRU.HHE. | 2017-12-14T01:14:18.51 | 0.6 | undecidable | manual | P | 20 | 216.5166 | 54 | -0.22 | 28 |
| IV.SOI.EHN. | 2017-12-14T01:14:18.43 | 0.3 | undecidable | manual | P | 34 | 220.0131 | 54 | -0.74 | 35 |
| IV.SOLUN.HHZ. | 2017-12-14T01:14:17.76 | 0.6 | undecidable | manual | P | 332 | 208.3359 | 54 | 0.04 | 31 |
| IV.MTTG.HHE. | 2017-12-14T01:14:16.00 | 0.6 | undecidable | manual | P | 28 | 197.1582 | 54 | -0.32 | 31 |
| IV.LPDG.HHE. | 2017-12-14T01:14:16.72 | 0.3 | undecidable | manual | P | 241 | 207.7365 | 54 | -0.92 | 34 |
| IV.CORL.HHZ. | 2017-12-14T01:14:16.66 | 0.3 | undecidable | manual | P | 324 | 200.6436 | 54 | -0.1 | 47 |
| IV.AGST.EHE. | 2017-12-14T01:14:15.79 | 0.6 | undecidable | manual | S | 29 | 104.5176 | 93 | -0.15 | 45 |
| IV.HLNI.HHZ. | 2017-12-14T01:14:15.03 | 0.6 | undecidable | manual | S | 11 | 103.119 | 93 | -0.53 | 42 |
| IV.NOV.HHZ. | 2017-12-14T01:14:15.09 | 0.6 | undecidable | manual | P | 14 | 181.7847 | 54 | 0.68 | 30 |
| IV.HAGA.HHZ. | 2017-12-14T01:14:15.52 | 0.6 | undecidable | manual | S | 25 | 104.4177 | 93 | -0.37 | 43 |
| IV.MMGO.HHN. | 2017-12-14T01:14:15.63 | 0.3 | undecidable | manual | P | 313 | 200.8434 | 54 | -1.16 | 32 |
| IV.MUCR.HHZ. | 2017-12-14T01:14:14.62 | 0.3 | undecidable | manual | P | 6 | 179.3871 | 54 | 0.51 | 49 |
| IV.MSFR.HHZ. | 2017-12-14T01:14:14.10 | 0.3 | undecidable | manual | P | 358 | 177.2892 | 54 | 0.25 | 53 |
| IV.PLLN.EHZ. | 2017-12-14T01:14:14.35 | 0.3 | undecidable | manual | P | 346 | 178.2882 | 54 | 0.38 | 51 |
| MN.CLTB.HHN. | 2017-12-14T01:14:14.57 | 0.6 | undecidable | manual | P | 315 | 179.1873 | 54 | 0.48 | 33 |
| IV.AIO.HHZ. | 2017-12-14T01:14:14.34 | 0.3 | undecidable | manual | P | 17 | 177.9885 | 54 | 0.41 | 51 |
| IV.CSLB.HHZ. | 2017-12-14T01:14:13.64 | 0.1 | negative | manual | P | 343 | 174.492 | 54 | 0.14 | 73 |
| IV.ALJA.HHZ. | 2017-12-14T01:14:13.28 | 0.3 | undecidable | manual | P | 332 | 165.7119 | 54 | 0.87 | 46 |
| IV.PETRA.HHZ. | 2017-12-14T01:14:12.30 | 0.1 | negative | manual | P | 343 | 162.0156 | 92 | 0.36 | 74 |
| IV.LINA.HHE. | 2017-12-14T01:14:12.94 | 0.6 | undecidable | manual | P | 249 | 171.5949 | 54 | -0.2 | 36 |
| IV.SSY.HHZ. | 2017-12-14T01:14:12.06 | 0.3 | undecidable | manual | S | 25 | 88.5447 | 93 | 0.39 | 65 |
| IV.EPZF.HHZ. | 2017-12-14T01:14:11.96 | 0.1 | positive | manual | P | 7 | 155.0226 | 92 | 1.09 | 57 |
| IV.EMSG.HHZ. | 2017-12-14T01:14:11.41 | 0.3 | undecidable | manual | P | 10 | 155.9217 | 92 | 0.41 | 56 |
| IV.RESU.HHZ. | 2017-12-14T01:14:10.26 | 0.3 | undecidable | manual | P | 339 | 144.1446 | 92 | 1.08 | 45 |
| IV.EPOZ.HHZ. | 2017-12-14T01:14:09.89 | 0.3 | undecidable | manual | P | 19 | 145.2435 | 92 | 0.54 | 56 |
| IV.GALF.HHZ. | 2017-12-14T01:14:09.13 | 0.1 | negative | manual | P | 357 | 141.5472 | 92 | 0.34 | 80 |
| IV.ESLN.HHZ. | 2017-12-14T01:14:09.67 | 0.3 | undecidable | manual | P | 12 | 142.4463 | 92 | 0.74 | 52 |
| IV.ESML.HHZ. | 2017-12-14T01:14:07.48 | 0.3 | undecidable | manual | P | 9 | 132.6672 | 92 | 0.05 | 65 |
| IV.HMDC.HHZ. | 2017-12-14T01:14:03.17 | 0.6 | undecidable | manual | S | 12 | 59.2962 | 95 | -0.7 | 43 |
| IV.HAGA.HHZ. | 2017-12-14T01:14:02.30 | 0.3 | undecidable | manual | P | 25 | 104.4177 | 93 | -0.77 | 56 |
| IV.AGST.EHE. | 2017-12-14T01:14:02.20 | 0.3 | undecidable | manual | P | 29 | 104.5176 | 93 | -0.89 | 53 |
| IV.HLNI.HHZ. | 2017-12-14T01:14:02.27 | 0.1 | positive | manual | P | 11 | 103.119 | 93 | -0.61 | 80 |
| IV.HPAC.HHE. | 2017-12-14T01:14:01.33 | 0.6 | undecidable | manual | S | 49 | 46.0206 | 97 | 0.96 | 37 |
| IV.SSY.HHZ. | 2017-12-14T01:14:00.23 | 0.1 | positive | manual | P | 25 | 88.5447 | 93 | -0.4 | 88 |
| IV.RAFF.HHZ. | 2017-12-14T01:14:00.38 | 0.1 | undecidable | manual | P | 344 | 90.8424 | 93 | -0.6 | 82 |
| IV.HMDC.HHZ. | 2017-12-14T01:13:55.10 | 0.1 | negative | manual | P | 12 | 59.2962 | 95 | -1.02 | 73 |
| IV.HPAC.HHE. | 2017-12-14T01:13:54.24 | 0.1 | positive | manual | P | 49 | 46.0206 | 97 | 0.14 | 100 |
| SCNL | mag | Generic_amplitude | Period | Type | Category | Unit | Time_window_reference |
|---|---|---|---|---|---|---|---|
| IV.HMDC.HHN. | ML:4.0 | 0.01958376 | 0.68 | AML | other | m | 2017-12-14T01:14:06.01 |
| IV.HMDC.HHE. | ML:4.1 | 0.02714775 | 0.72 | AML | other | m | 2017-12-14T01:14:11.57 |
| IV.SSY.HHE. | ML:4.3 | 0.023481210000000002 | 0.64 | AML | other | m | 2017-12-14T01:14:12.94 |
| IV.SSY.HHN. | ML:4.2 | 0.020316935 | 0.32 | AML | other | m | 2017-12-14T01:14:16.42 |
| IV.RAFF.HHN. | ML:3.3 | 0.002316311 | 0.94 | AML | other | m | 2017-12-14T01:14:14.90 |
| IV.RAFF.HHE. | ML:3.4 | 0.0028382005 | 0.6 | AML | other | m | 2017-12-14T01:14:20.00 |
| IV.HLNI.HHE. | ML:3.8 | 0.006632539 | 0.24 | AML | other | m | 2017-12-14T01:14:17.79 |
| IV.HLNI.HHN. | ML:3.7 | 0.004981519 | 0.38 | AML | other | m | 2017-12-14T01:14:18.13 |
| IV.ESML.HHN. | ML:3.9 | 0.005333111000000001 | 0.8 | AML | other | m | 2017-12-14T01:14:40.47 |
| IV.ESML.HHE. | ML:3.8 | 0.0043949815 | 0.9 | AML | other | m | 2017-12-14T01:14:33.47 |
| IV.GALF.HHN. | ML:3.8 | 0.003750916 | 0.66 | AML | other | m | 2017-12-14T01:14:32.82 |
| IV.GALF.HHE. | ML:3.9 | 0.004412371 | 0.6 | AML | other | m | 2017-12-14T01:14:32.73 |
| IV.ESLN.HHN. | ML:4.0 | 0.005768484 | 0.9 | AML | other | m | 2017-12-14T01:14:34.86 |
| IV.ESLN.HHE. | ML:4.1 | 0.007625553 | 0.98 | AML | other | m | 2017-12-14T01:14:48.35 |
| IV.EPOZ.HHE. | ML:4.0 | 0.0053666905 | 1.02 | AML | other | m | 2017-12-14T01:14:37.14 |
| IV.EPOZ.HHN. | ML:4.0 | 0.005019164 | 1.04 | AML | other | m | 2017-12-14T01:14:47.14 |
| IV.RESU.HHN. | ML:3.6 | 0.0024749675 | 1.02 | AML | other | m | 2017-12-14T01:14:36.30 |
| IV.RESU.HHE. | ML:3.5 | 0.0016805004999999999 | 0.76 | AML | other | m | 2017-12-14T01:14:40.83 |
| IV.EMSG.HHN. | ML:4.0 | 0.005225652 | 0.92 | AML | other | m | 2017-12-14T01:14:44.41 |
| IV.EMSG.HHE. | ML:4.0 | 0.004955593 | 0.62 | AML | other | m | 2017-12-14T01:14:40.89 |
| IV.EPZF.HHN. | ML:4.1 | 0.005688895 | 0.58 | AML | other | m | 2017-12-14T01:14:40.27 |
| IV.EPZF.HHE. | ML:4.1 | 0.005500481 | 0.86 | AML | other | m | 2017-12-14T01:14:37.73 |
| IV.PETRA.HHN. | ML:3.7 | 0.002148951 | 0.88 | AML | other | m | 2017-12-14T01:14:49.57 |
| IV.PETRA.HHE. | ML:3.7 | 0.0024325584999999998 | 0.86 | AML | other | m | 2017-12-14T01:14:42.67 |
| IV.ALJA.HHE. | ML:3.4 | 0.00095129435 | 0.6 | AML | other | m | 2017-12-14T01:14:44.17 |
| IV.ALJA.HHN. | ML:3.3 | 0.00092580005 | 1.04 | AML | other | m | 2017-12-14T01:14:57.60 |
| IV.CSLB.HHN. | ML:3.3 | 0.0007325306499999999 | 1.34 | AML | other | m | 2017-12-14T01:14:45.73 |
| IV.CSLB.HHE. | ML:3.4 | 0.00100007275 | 0.66 | AML | other | m | 2017-12-14T01:14:48.74 |
| IV.MSFR.HHE. | ML:3.5 | 0.0012820070000000002 | 0.94 | AML | other | m | 2017-12-14T01:14:51.94 |
| IV.MSFR.HHN. | ML:3.6 | 0.001385723 | 0.96 | AML | other | m | 2017-12-14T01:14:45.88 |
| IV.AIO.HHN. | ML:3.7 | 0.00181431265 | 0.7 | AML | other | m | 2017-12-14T01:14:49.76 |
| IV.AIO.HHE. | ML:3.8 | 0.002654365 | 0.46 | AML | other | m | 2017-12-14T01:14:43.68 |
| IV.PLLN.EHE. | ML:3.9 | 0.003083938 | 0.96 | AML | other | m | 2017-12-14T01:14:45.41 |
| IV.PLLN.EHN. | ML:4.0 | 0.003559701 | 0.54 | AML | other | m | 2017-12-14T01:14:48.01 |
| IV.MUCR.HHE. | ML:3.9 | 0.0029025569999999996 | 0.64 | AML | other | m | 2017-12-14T01:14:49.63 |
| IV.MUCR.HHN. | ML:3.8 | 0.002130453 | 0.58 | AML | other | m | 2017-12-14T01:14:50.70 |
| IV.SOLUN.HHE. | ML:3.8 | 0.001750376 | 0.9 | AML | other | m | 2017-12-14T01:14:55.86 |
| IV.SOLUN.HHN. | ML:3.6 | 0.00115945045 | 0.88 | AML | other | m | 2017-12-14T01:14:55.78 |
TDMT details
| Field | Value |
|---|---|
| Magnitude | 3.8 |
| Scalar Moment | 6.83207E+21 dyne-cm |
| Computed depth | 5 km |
| Quality | Ca |
| Variance Reduction | 34.42% |
| Double Couple | 63% |
| CLVD | 37% |
| ISO | 0% |
| Model used | CIA |
| Mode | automatic |
| Status | preliminary |
Moment Tensor Components
| Component | Value |
|---|---|
| Mrr | 1.9155E+21 |
| Mtt | 3.6589E+21 |
| Mpp | -5.5744E+21 |
| Mrt | 1.7314E+21 |
| Mrp | 4.1349E+21 |
| Mtp | 1.9892E+21 |
Nodal Planes
| Name | Strike | Dip | Rake |
|---|---|---|---|
| PN1 | 26 | 80 | 134 |
| PN2 | 126 | 45 | 14 |
Fault Plane solution

psmeca (GMT documentation)
14.752 36.2953 5 26 80 134 126 45 14 6.83207 21 15.252 36.7953TDMT references
More info and referencesPDF Solution

Station Distribution
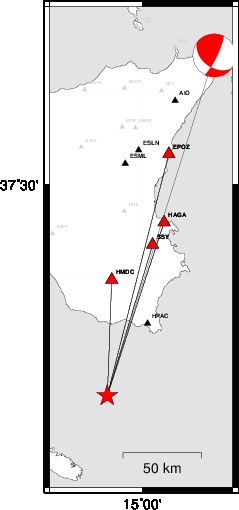
TDMT station details
| Station | Distance (km) | Azimuth | Variance Reduction | zcor |
|---|---|---|---|---|
| EPOZ | 157.6 | 14.1 | 22.83% | 113 |
| HAGA | 115.6 | 18 | 57.14% | 106 |
| HMDC | 73.7 | 2.2 | 22.23% | 100 |
| SSY | 99.9 | 16.6 | 74.38% | 104 |