Terremoto di magnitudo ML 3.5 del 20-05-2012 ore 12:59:17 (Italia) in zona: 5 km NE Finale Emilia (MO)
Un terremoto di magnitudo ML 3.5 è avvenuto nella zona: 5 km NE Finale Emilia (MO), il
- 20-05-2012 10:59:17 (UTC)
- 20-05-2012 12:59:17 (UTC +02:00) ora italiana
con coordinate geografiche (lat, lon) 44.8750, 11.3320 ad una profondità di 8 km.
Il terremoto è stato localizzato da: Bollettino Sismico Italiano INGV.
Ricerca terremoti: Qualsiasi nel raggio di 30 km
I valori delle coordinate ipocentrali e della magnitudo rappresentano la migliore stima con i dati a disposizione. Eventuali nuovi dati o analisi potrebbero far variare tali stime.
Comuni entro 20 km dall'epicentro
| Comune | Provincia | Distanza (km) | Popolazione | Cumulata Popolazione |
|---|---|---|---|---|
| Finale Emilia | MO | 5 | 15699 | 15699 |
| Bondeno | FE | 7 | 14655 | 30354 |
| Sant'Agostino | FE | 10 | 6853 | 37207 |
| Mirabello | FE | 12 | 3266 | 40473 |
| Ficarolo | RO | 12 | 2438 | 42911 |
| Felonica | MN | 12 | 1359 | 44270 |
| Calto | RO | 13 | 743 | 45013 |
| Vigarano Mainarda | FE | 14 | 7694 | 52707 |
| Salara | RO | 14 | 1160 | 53867 |
| Gaiba | RO | 15 | 1063 | 54930 |
| Sermide | MN | 15 | 6189 | 61119 |
| San Felice sul Panaro | MO | 15 | 10900 | 72019 |
| Ceneselli | RO | 16 | 1719 | 73738 |
| Castelmassa | RO | 16 | 4252 | 77990 |
| Cento | FE | 17 | 35686 | 113676 |
| Galliera | BO | 17 | 5439 | 119115 |
| Poggio Renatico | FE | 17 | 9852 | 128967 |
| Castelnovo Bariano | RO | 17 | 2762 | 131729 |
| Pieve di Cento | BO | 18 | 7019 | 138748 |
| Camposanto | MO | 18 | 3201 | 141949 |
| Stienta | RO | 18 | 3253 | 145202 |
| Magnacavallo | MN | 19 | 1561 | 146763 |
| Carbonara di Po | MN | 20 | 1297 | 148060 |
| San Pietro in Casale | BO | 20 | 12202 | 160262 |
Città più vicine con almeno 50000 abitanti
Queste mappe mostrano l'attività sismica della zona in diversi intervalli temporali, precedenti all’evento sismico a cui si riferiscono. Per quel che riguarda le prime due mappe, i dati riportati provengono dalle analisi effettuate in tempo reale dal personale delle Sale Operative dell'INGV subito dopo ogni terremoto. La terza mappa mostra i dati dal 1985 alla data del terremoto: le localizzazioni sono riviste dagli analisti sismologi del Bollettino Sismico Italiano dell'INGV. I parametri della localizzazione (coordinate ipocentrali e magnitudo) sono la migliore stima possibile con i dati a disposizione dell’INGV, ma sono costantemente aggiornati in funzione di ulteriori dati che si rendano disponibili. I parametri della localizzazione e della magnitudo, successivamente rivisti dagli analisti sismologi, possono variare.
I terremoti dei 3 giorni precedenti l'evento
I terremoti dei 90 giorni precedenti l'evento
I terremoti dal 1985 alla data dell'evento
I terremoti dall'anno 1000 al 2019
Con pericolosità sismica si intende lo scuotimento del suolo atteso in un sito a causa di un terremoto. Essendo prevalentemente un’analisi di tipo probabilistico, si può definire un certo scuotimento solo associato alla probabilità di accadimento nel prossimo futuro. Non si tratta pertanto di previsione deterministica dei terremoti, obiettivo lungi dal poter essere raggiunto ancora in tutto il mondo, né del massimo terremoto possibile in un’area, in quanto il terremoto massimo ha comunque probabilità di verificarsi molto basse.
Nel 2004 è stata rilasciata questa mappa della pericolosità sismica (http://zonesismiche.mi.ingv.it) che fornisce un quadro delle aree più pericolose in Italia. La mappa di pericolosità sismica del territorio nazionale (GdL MPS, 2004; rif. Ordinanza PCM del 28 aprile 2006, n. 3519, All. 1b) è espressa in termini di accelerazione orizzontale del suolo con probabilità di eccedenza del 10% in 50 anni, riferita a suoli rigidi (Vs30>800 m/s; cat. A, punto 3.2.1 del D.M. 14.09.2005).
I colori indicano i diversi valori di accelerazione del terreno che hanno una probabilità del 10% di essere superati in 50 anni. Indicativamente i colori associati ad accelerazioni più basse indicano zone meno pericolose, dove la frequenza di terremoti più forti è minore rispetto a quelle più pericolose, ma questo non significa che non possano verificarsi.
Mappa di pericolosità sismica
Le tre mappe mostrano i risultati dell'elaborazione denominata ShakeMap per la stima dei parametri di scuotimento del suolo sulla base dei dati registrati dai sismometri e dagli accelerometri e delle successive interpolazioni basate sulle conoscenze sismologiche. Le mappe di scuotimento - ShakeMap - sono calcolate solo a fini di ricerca e danno esclusivamente stime indicative dello scuotimento prodotto dal terremoto. Sono calcolate automaticamente dai dati strumentali registrati dalle stazioni sismiche ed aggiornate man mano che nuovi dati diventano disponibili. Per ulteriori informazioni è possibile consultare il sito https://shakemap.ingv.it. La stella nera è l’epicentro del terremoto avvenuto. I triangoli sono le stazioni accelerometriche e velocimetriche usate nel calcolo, colorate in base allo scuotimento registrato.
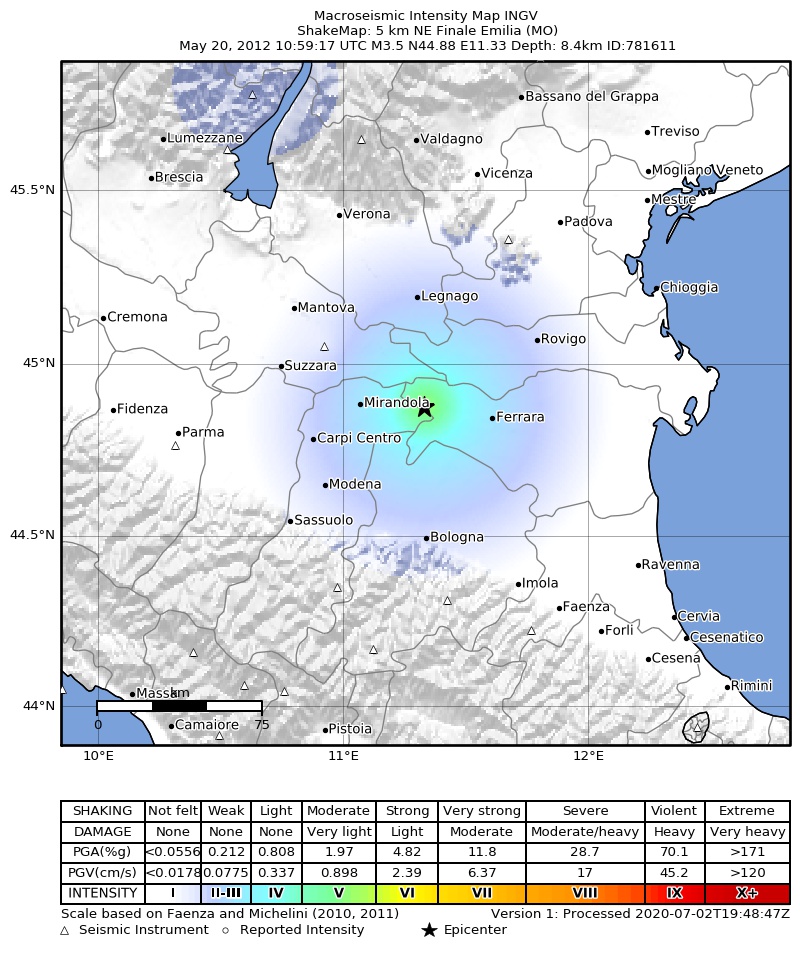
Mappa di scuotimento: intensità
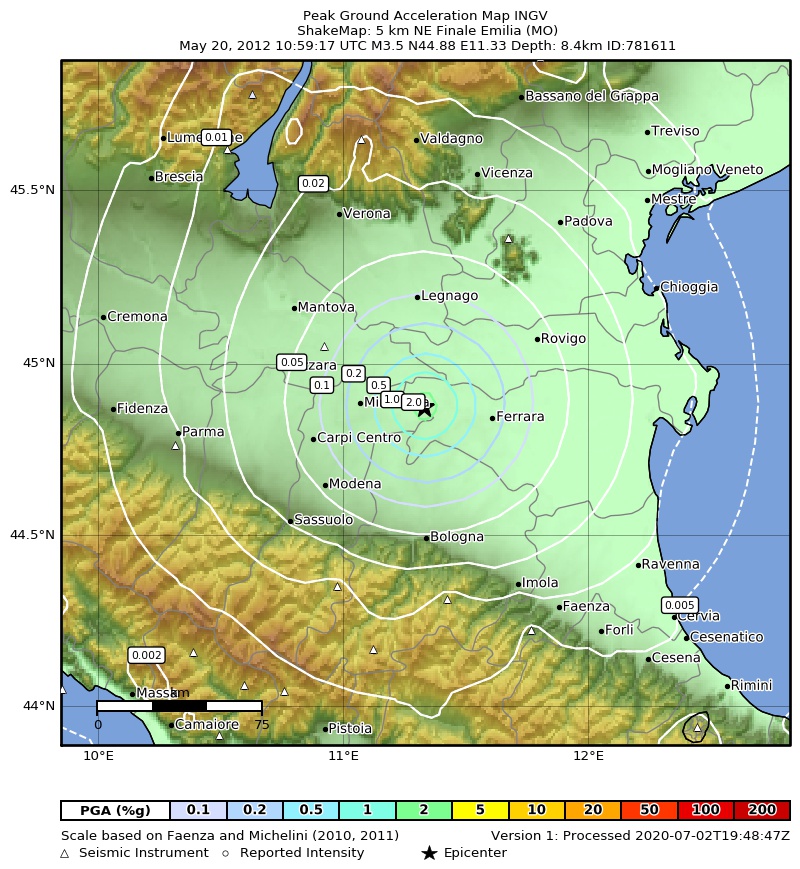
Mappa di scuotimento: accelerazione
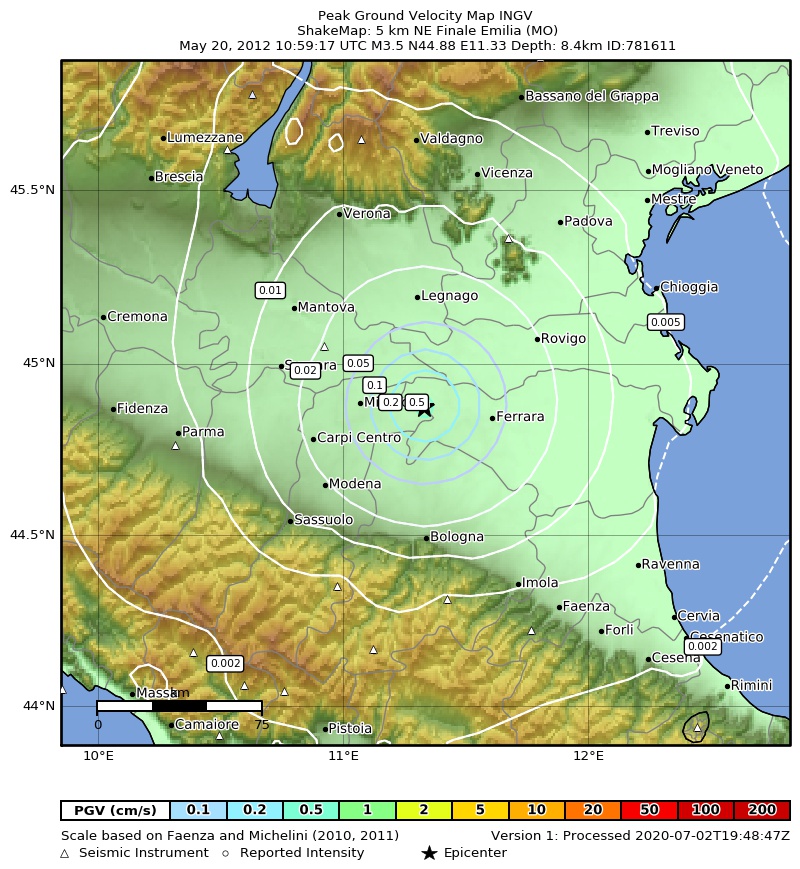
Mappa di scuotimento: velocità
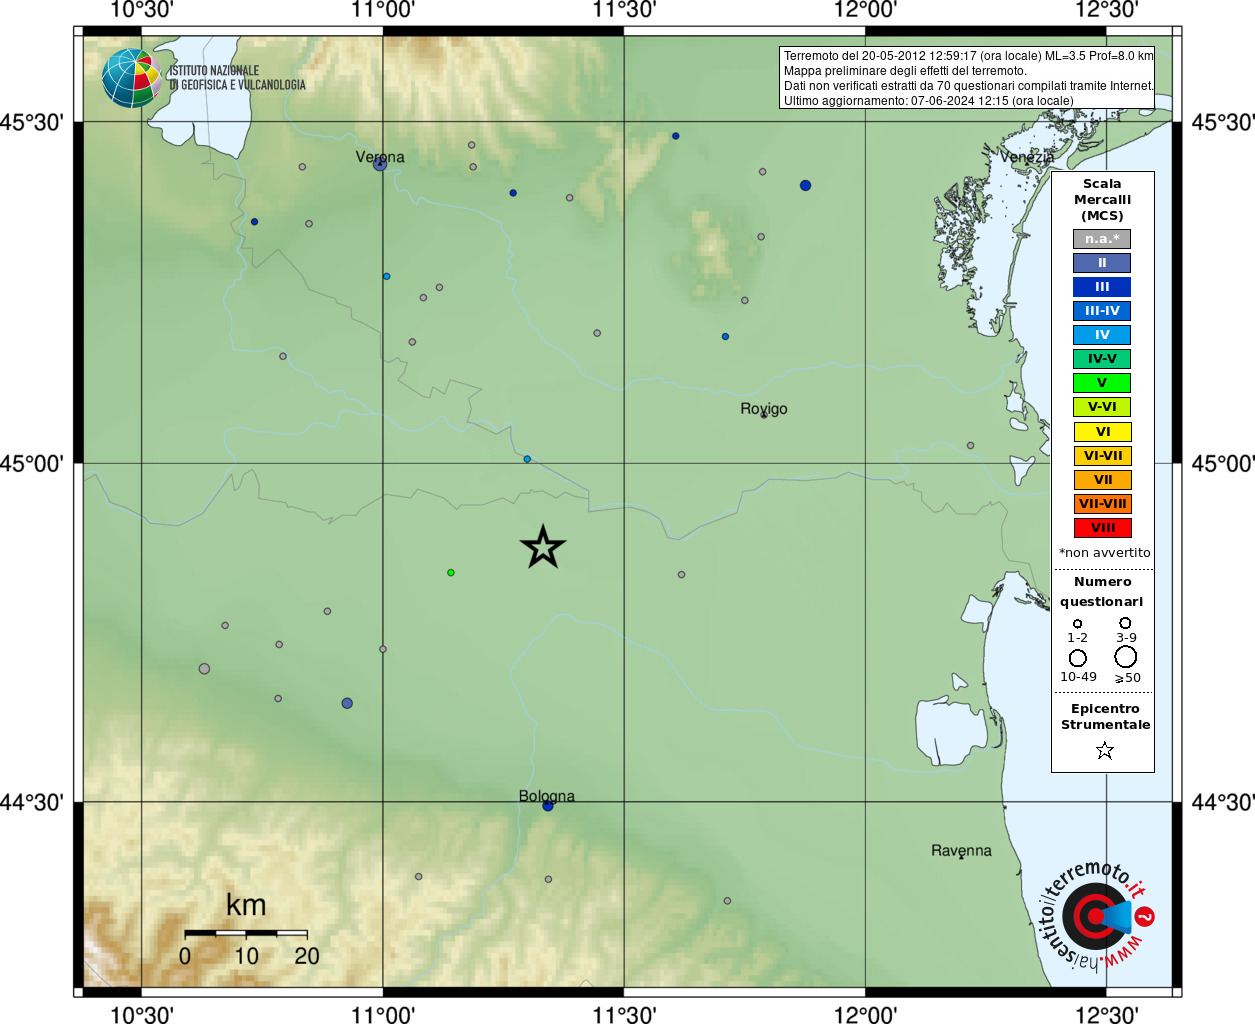
Mappa preliminare del risentimento dai questionari su web
| Tipo | Magnitudo | Tempo origine (UTC) | Latitudine | Longitudine | Profondità (km) | Ora pubblicazione (UTC) | Autore | ID Localizzazione |
|---|---|---|---|---|---|---|---|---|
|
Rivista Rev100 |
ML 3.5 | 2012-05-20 10:59:19 |
44.8868 | 11.3452 | 1 | 2014-10-21 12:19:34 |
Sala Sismica INGV-Roma | 1326491 |
|
Bollettino Rev1000 |
ML 3.5 | 2012-05-20 10:59:17 |
44.875 | 11.3315 | 8 | 2014-09-19 08:14:18 |
Bollettino Sismico Italiano INGV | 4948451 |
Localizzazione
| Campo | Valore |
|---|---|
| Tempo (UTC) | 2012-05-20 10:59:17 ± 0.23 |
| Latitudine | 44.8750 ± 0.0045 |
| Longitudine | 11.3315 ± 0.0089 |
| Profondità (km) | 8 ± 1 (from location) |
| Metodo di valutazione | manual |
| Stato della valutazione | reviewed |
| Versione | 1000 -> BULLETIN-INGV |
| Tipo di evento | earthquake |
| ID localizzazione | 4948451 |
Incertezze
| Campo | Valore |
|---|---|
| Tipo di incertezza | uncertainty ellipse |
| Semi-asse maggiore dell'ellisse di confidenza (metri) | 630 |
| Semi-asse minore dell'ellisse di confidenza (metri) | 475 |
| azimuth dell’asse maggiore dell’ellisse di confidenza (gradi) | 79 |
| Regione di confidenza sul piano orizzontale espressa mediante singolo valore di incertezza (metri) | 630.0 |
| Livello di confidenza dell'incertezza (%) | 68 |
Qualità
| Campo | Valore |
|---|---|
| Maggiore gap azimutale nella distribuzione delle stazioni all'epicentro | 96 |
| Numero di fasi associato indipendentemente se utilizzate nella localizzazione (determinazione dell'Origin) | 65 |
| Numero di fasi | 65 |
| Scarto quadratico medio dei residui di tempo risultanti dal calcolo del tempo origine (Origin) della localizzazione (sec) | 0.4 |
| Distanza epicentrale della stazione piu' vicina (gradi) | 0.13760 |
| Distanza epicentrale della stazione piu’ lontana (gradi) | 2.00639 |
| Numero di stazioni in cui l’evento e’ stato osservato | 61 |
| Numero di stazioni usate nel calcolo dell'Origin | 61 |
ML:3.5
| Campo | Valore |
|---|---|
| Valore | 3.5 |
| Incertezza | 0.3 |
| Num. stazioni usate | 0 |
| Tipo di magnitudo | ML |
| Localizzazione di riferimento | 1326491 |
| Agenzia | INGV |
| Autore | Sala Sismica INGV-Roma |
| Tempo di creazione (UTC) | 2012-05-20 11:10:06 |
ML:3.5
| Campo | Valore |
|---|---|
| Valore | 3.5 |
| Incertezza | 0.3 |
| Num. stazioni usate | 75 |
| Tipo di magnitudo | ML |
| Localizzazione di riferimento | 4948451 |
| Agenzia | INGV |
| Autore | Manually reviewed by Franco Mele |
| Tempo di creazione (UTC) | 2014-09-18 12:47:09 |
| SCNL | Time | Uncertainty | Polarity | Evaluation_mode | Phase | Azimuth | Distance(km) | Takeoff_angle | Residual | Weight |
|---|---|---|---|---|---|---|---|---|---|---|
| GU.PCP.HHZ. | 2012-05-20T10:59:54.93 | 0.6 | undecidable | manual | P | 261 | 222.7104 | 38 | -1.43 | 16 |
| NI.VINO.HHZ. | 2012-05-20T10:59:52.74 | 0.3 | undecidable | manual | P | 44 | 214.9182 | 38 | -2.41 | 11 |
| SI.ABSI.HHZ. | 2012-05-20T10:59:52.48 | 0.6 | undecidable | manual | P | 360 | 205.6386 | 38 | -1.22 | 20 |
| SI.MOSI.HHZ. | 2012-05-20T10:59:52.80 | 0.6 | undecidable | manual | P | 343 | 202.4418 | 38 | -0.41 | 28 |
| IV.ATTE.HHZ. | 2012-05-20T10:59:51.72 | 0.6 | undecidable | manual | P | 156 | 203.1411 | 38 | -1.6 | 16 |
| IV.BRMO.HHZ. | 2012-05-20T10:59:51.10 | 0.6 | undecidable | manual | P | 338 | 192.5628 | 38 | -0.57 | 29 |
| IV.ATVO.HHZ. | 2012-05-20T10:59:50.38 | 0.6 | undecidable | manual | P | 152 | 186.369 | 38 | -0.34 | 31 |
| IV.ATVA.EHZ. | 2012-05-20T10:59:50.70 | 0.6 | undecidable | manual | P | 156 | 192.6627 | 38 | -1 | 24 |
| IV.ATPI.EHZ. | 2012-05-20T10:59:49.81 | 0.6 | undecidable | manual | P | 151 | 179.487 | 38 | 0.16 | 34 |
| IV.ATMC.EHZ. | 2012-05-20T10:59:48.50 | 0.6 | undecidable | manual | P | 156 | 172.5939 | 38 | -0.08 | 36 |
| IV.APPI.EHZ. | 2012-05-20T10:59:48.97 | 0.3 | undecidable | manual | P | 357 | 178.0884 | 38 | -0.46 | 48 |
| IV.MPAG.EHZ. | 2012-05-20T10:59:48.56 | 0.6 | undecidable | manual | P | 140 | 178.7877 | 38 | -0.98 | 26 |
| SI.KOSI.HHZ. | 2012-05-20T10:59:48.26 | 0.6 | undecidable | manual | P | 1 | 176.1903 | 38 | -0.87 | 28 |
| IV.PIEI.HHZ. | 2012-05-20T10:59:48.58 | 0.6 | undecidable | manual | P | 147 | 176.6898 | 38 | -0.64 | 30 |
| IV.CAFI.HHZ. | 2012-05-20T10:59:48.87 | 0.6 | undecidable | manual | P | 163 | 178.7877 | 38 | -0.66 | 30 |
| IV.BADI.EHZ. | 2012-05-20T10:59:48.37 | 0.3 | undecidable | manual | P | 154 | 168.0096 | 38 | 0.52 | 50 |
| IV.NARO.HHZ. | 2012-05-20T10:59:47.89 | 0.6 | undecidable | manual | P | 144 | 171.7947 | 38 | -0.56 | 32 |
| IV.PARC.HHZ. | 2012-05-20T10:59:46.24 | 0.3 | undecidable | manual | P | 152 | 153.9348 | 38 | 0.56 | 52 |
| IV.MSSA.HHZ. | 2012-05-20T10:59:46.48 | 0.6 | undecidable | manual | P | 247 | 156.1215 | 38 | 0.46 | 36 |
| NI.AGOR.HHZ. | 2012-05-20T10:59:46.81 | 0.6 | undecidable | manual | P | 20 | 160.5171 | 38 | 0.1 | 38 |
| IV.PLMA.HHZ. | 2012-05-20T10:59:45.14 | 0.3 | undecidable | manual | P | 232 | 148.5402 | 38 | 0.3 | 57 |
| NI.POLC.HHZ. | 2012-05-20T10:59:45.77 | 0.3 | undecidable | manual | P | 35 | 156.8208 | 38 | -0.35 | 54 |
| IV.BOB.HHZ. | 2012-05-20T10:59:45.60 | 0.3 | undecidable | manual | P | 266 | 148.74 | 38 | 0.74 | 50 |
| IV.CSNT.HHZ. | 2012-05-20T10:59:45.75 | 0.3 | undecidable | manual | P | 181 | 155.5221 | 38 | -0.18 | 57 |
| IV.MABI.HHZ. | 2012-05-20T10:59:44.25 | 0.3 | undecidable | manual | P | 334 | 145.5432 | 38 | -0.12 | 60 |
| IV.CTL8.EHZ. | 2012-05-20T10:59:43.54 | 0.6 | undecidable | manual | P | 290 | 130.7691 | 38 | 1.47 | 24 |
| IV.CTI.HHZ. | 2012-05-20T10:59:42.72 | 0.3 | undecidable | manual | P | 11 | 132.4674 | 38 | 0.38 | 58 |
| GU.MAIM.HHZ. | 2012-05-20T10:59:41.84 | 0.3 | undecidable | manual | P | 212 | 125.6742 | 38 | 0.55 | 56 |
| IV.CRMI.HHZ. | 2012-05-20T10:59:41.29 | 0.3 | undecidable | manual | P | 193 | 122.988 | 38 | 0.43 | 59 |
| IV.BAG8.HNE. | 2012-05-20T10:59:40.97 | 0.6 | undecidable | manual | P | 328 | 124.8861 | 38 | -0.2 | 41 |
| NI.CGRP.HHZ. | 2012-05-20T10:59:40.24 | 0.3 | negative | manual | P | 18 | 117.4935 | 38 | 0.22 | 62 |
| IV.SFI.EHZ. | 2012-05-20T10:59:40.00 | 0.3 | undecidable | manual | P | 159 | 115.0959 | 38 | 0.35 | 61 |
| IV.BDI.HHZ. | 2012-05-20T10:59:38.75 | 1.0 | undecidable | manual | P | 213 | 107.3148 | 38 | 0.32 | 21 |
| MN.VLC.HHZ. | 2012-05-20T10:59:38.32 | 0.6 | undecidable | manual | P | 224 | 109.0131 | 38 | -0.38 | 41 |
| IV.PTF.SHZ. | 2012-05-20T10:59:38.34 | 0.3 | negative | manual | P | 192 | 103.5186 | 38 | 0.49 | 60 |
| IV.MAGA.HHE. | 2012-05-20T10:59:38.96 | 0.6 | undecidable | manual | P | 331 | 113.8971 | 38 | -0.5 | 39 |
| IV.VOBA.HNE. | 2012-05-20T10:59:38.38 | 0.3 | undecidable | manual | P | 323 | 106.9152 | 38 | 0 | 66 |
| IV.SALO.HHZ. | 2012-05-20T10:59:37.66 | 0.3 | undecidable | manual | P | 323 | 103.8183 | 38 | -0.23 | 64 |
| GU.POPM.HHZ. | 2012-05-20T10:59:37.11 | 0.3 | undecidable | manual | P | 206 | 102.7194 | 38 | -0.61 | 58 |
| IV.ZEN8.HNE. | 2012-05-20T10:59:37.08 | 1.0 | undecidable | manual | P | 331 | 96.7254 | 38 | 0.29 | 21 |
| IV.ERBM.EHE. | 2012-05-20T10:59:36.27 | 0.3 | undecidable | manual | P | 235 | 88.3449 | 38 | 0.77 | 55 |
| IV.SEI.SHZ. | 2012-05-20T10:59:36.07 | 1.0 | undecidable | manual | P | 179 | 91.0422 | 38 | 0.16 | 22 |
| IV.PRMA.HHZ. | 2012-05-20T10:59:35.03 | 0.3 | undecidable | manual | P | 262 | 81.0522 | 38 | 0.67 | 59 |
| IV.SANR.HNE. | 2012-05-20T10:59:35.86 | 0.3 | undecidable | manual | P | 14 | 87.6456 | 38 | 0.49 | 62 |
| IV.MODE.HNE. | 2012-05-20T10:59:35.80 | 0.6 | undecidable | manual | S | 228 | 40.626 | 50 | -0.87 | 39 |
| IV.BRIS.HHZ. | 2012-05-20T10:59:35.08 | 0.3 | undecidable | manual | P | 154 | 79.9644 | 38 | 0.9 | 53 |
| IV.ROVR.HHZ. | 2012-05-20T10:59:35.19 | 0.1 | negative | manual | P | 347 | 87.9453 | 38 | -0.24 | 87 |
| IV.FNVD.HHE. | 2012-05-20T10:59:33.66 | 0.3 | negative | manual | P | 192 | 80.1642 | 38 | -0.56 | 62 |
| IV.IMOL.EHZ. | 2012-05-20T10:59:33.04 | 0.3 | undecidable | manual | P | 150 | 65.7897 | 38 | 1.06 | 51 |
| IV.TREG.HNZ. | 2012-05-20T10:59:33.17 | 0.6 | undecidable | manual | P | 350 | 73.0713 | 38 | 0.05 | 47 |
| IV.ZCCA.HHZ. | 2012-05-20T10:59:32.46 | 0.1 | negative | manual | P | 206 | 64.5909 | 38 | 0.67 | 81 |
| IV.MTRZ.HHZ. | 2012-05-20T10:59:32.05 | 0.3 | negative | manual | P | 173 | 62.7927 | 38 | 0.53 | 64 |
| IV.ZOVE.HNE. | 2012-05-20T10:59:31.79 | 0.3 | undecidable | manual | P | 11 | 65.3901 | 38 | -0.13 | 70 |
| IV.TEOL.HHZ. | 2012-05-20T10:59:31.20 | 0.1 | negative | manual | P | 26 | 60.2952 | 38 | 0.07 | 95 |
| IV.MNTV.HNZ. | 2012-05-20T10:59:30.15 | 0.6 | undecidable | manual | P | 306 | 52.3032 | 38 | 0.26 | 46 |
| IV.FIU.EHZ. | 2012-05-20T10:59:30.30 | 0.6 | undecidable | manual | S | 154 | 28.9488 | 50 | -1.26 | 33 |
| IV.OPPE.HNZ. | 2012-05-20T10:59:29.52 | 0.3 | undecidable | manual | P | 346 | 49.617 | 38 | 0.04 | 73 |
| IV.NOVE.EHZ. | 2012-05-20T10:59:28.43 | 0.3 | undecidable | manual | P | 260 | 49.1175 | 50 | -2.2 | 24 |
| IV.RAVA.EHZ. | 2012-05-20T10:59:28.20 | 0.3 | undecidable | manual | S | 232 | 21.3675 | 50 | -0.03 | 77 |
| IV.SERM.EHZ. | 2012-05-20T10:59:27.50 | 0.6 | undecidable | manual | S | 349 | 15.2736 | 119 | -0.23 | 50 |
| IV.MODE.HNE. | 2012-05-20T10:59:27.55 | 0.3 | undecidable | manual | P | 228 | 40.626 | 50 | -0.94 | 57 |
| IV.SBPO.HHE. | 2012-05-20T10:59:27.58 | 1.0 | undecidable | manual | P | 301 | 37.7289 | 50 | -0.2 | 24 |
| IV.FIU.EHZ. | 2012-05-20T10:59:25.36 | 0.1 | negative | manual | P | 154 | 28.9488 | 50 | -0.2 | 98 |
| IV.SERM.EHZ. | 2012-05-20T10:59:23.66 | 0.1 | negative | manual | P | 349 | 15.2736 | 119 | 0.28 | 99 |
| IV.RAVA.EHZ. | 2012-05-20T10:59:23.84 | 0.1 | positive | manual | P | 232 | 21.3675 | 50 | 0.18 | 100 |
| SCNL | mag | Generic_amplitude | Period | Type | Category | Unit | Time_window_reference |
|---|---|---|---|---|---|---|---|
| SI.ABSI.HHN. | ML:4.1 | 0.003715 | 0.72 | AML | other | m | 2012-05-20T11:00:22.71 |
| SI.ABSI.HHE. | ML:4.0 | 0.0028599999999999997 | 0.62 | AML | other | m | 2012-05-20T11:00:23.30 |
| NI.ACOM.HHE. | ML:3.9 | 0.0013700000000000001 | 0.6 | AML | other | m | 2012-05-20T11:00:45.52 |
| NI.ACOM.HHN. | ML:3.7 | 0.0009004999999999999 | 0.54 | AML | other | m | 2012-05-20T11:00:45.59 |
| NI.AGOR.HHE. | ML:3.5 | 0.001515 | 1.42 | AML | other | m | 2012-05-20T11:00:12.10 |
| NI.AGOR.HHN. | ML:3.6 | 0.0019549999999999997 | 1.14 | AML | other | m | 2012-05-20T11:00:13.17 |
| IV.APPI.EHE. | ML:4.0 | 0.00408 | 0.36 | AML | other | m | 2012-05-20T11:00:12.99 |
| IV.APPI.EHN. | ML:3.9 | 0.0028550000000000003 | 0.44 | AML | other | m | 2012-05-20T11:00:13.26 |
| IV.ARCI.HHE. | ML:2.7 | 0.00011499999999999999 | 0.86 | AML | other | m | 2012-05-20T11:00:15.09 |
| IV.ARCI.HHN. | ML:2.9 | 0.000189 | 1.1 | AML | other | m | 2012-05-20T11:00:51.86 |
| IV.ASSB.HHE. | ML:3.2 | 0.0003515 | 0.72 | AML | other | m | 2012-05-20T11:00:42.85 |
| IV.ASSB.HHN. | ML:3.3 | 0.000432 | 0.76 | AML | other | m | 2012-05-20T11:00:37.03 |
| IV.ATBU.EHN. | ML:3.6 | 0.00148 | 0.6 | AML | other | m | 2012-05-20T11:00:33.77 |
| IV.ATBU.EHE. | ML:3.7 | 0.0019199999999999998 | 0.54 | AML | other | m | 2012-05-20T11:00:24.48 |
| IV.ATMC.EHE. | ML:3.4 | 0.0009495 | 0.56 | AML | other | m | 2012-05-20T11:00:17.95 |
| IV.ATMC.EHN. | ML:3.4 | 0.001027 | 0.7 | AML | other | m | 2012-05-20T11:00:18.24 |
| IV.ATMI.HHE. | ML:3.4 | 0.0008274999999999999 | 0.72 | AML | other | m | 2012-05-20T11:00:28.91 |
| IV.ATMI.HHN. | ML:3.6 | 0.001265 | 0.64 | AML | other | m | 2012-05-20T11:00:28.98 |
| IV.ATPC.HHN. | ML:3.4 | 0.0009945 | 0.54 | AML | other | m | 2012-05-20T11:00:22.07 |
| IV.ATPC.HHE. | ML:3.4 | 0.00092 | 0.76 | AML | other | m | 2012-05-20T11:00:20.79 |
| IV.ATPI.EHE. | ML:3.2 | 0.000551 | 1.22 | AML | other | m | 2012-05-20T11:00:24.25 |
| IV.ATPI.EHN. | ML:3.2 | 0.000652 | 0.88 | AML | other | m | 2012-05-20T11:00:30.35 |
| IV.ATTE.HHN. | ML:3.2 | 0.00047050000000000005 | 0.74 | AML | other | m | 2012-05-20T11:00:38.63 |
| IV.ATTE.HHE. | ML:3.2 | 0.000435 | 0.7 | AML | other | m | 2012-05-20T11:00:38.38 |
| IV.ATVA.EHE. | ML:3.1 | 0.000374 | 0.9 | AML | other | m | 2012-05-20T11:00:38.26 |
| IV.ATVA.EHN. | ML:2.9 | 0.00027249999999999996 | 0.72 | AML | other | m | 2012-05-20T11:00:33.88 |
| IV.ATVO.HHE. | ML:3.4 | 0.0008309999999999999 | 0.68 | AML | other | m | 2012-05-20T11:00:25.05 |
| IV.ATVO.HHN. | ML:3.4 | 0.0008349999999999999 | 0.68 | AML | other | m | 2012-05-20T11:00:24.62 |
| IV.BADI.EHE. | ML:3.3 | 0.0008795 | 0.72 | AML | other | m | 2012-05-20T11:00:30.31 |
| IV.BADI.EHN. | ML:3.2 | 0.0006485 | 0.58 | AML | other | m | 2012-05-20T11:00:14.17 |
| IV.BDI.HNN. | ML:3.6 | 0.0036750000000000003 | 0.48 | AML | other | m | 2012-05-20T11:00:03.97 |
| IV.BDI.HHN. | ML:3.6 | 0.003895 | 0.48 | AML | other | m | 2012-05-20T11:00:03.97 |
| IV.BDI.HHE. | ML:3.5 | 0.002935 | 0.8 | AML | other | m | 2012-05-20T10:59:58.37 |
| IV.BDI.HNE. | ML:3.6 | 0.00343 | 0.78 | AML | other | m | 2012-05-20T10:59:58.37 |
| IV.BOB.HNN. | ML:3.5 | 0.001585 | 0.84 | AML | other | m | 2012-05-20T11:00:09.08 |
| IV.BOB.HNE. | ML:3.7 | 0.00275 | 1.3 | AML | other | m | 2012-05-20T11:00:09.96 |
| SI.BOSI.HHE. | ML:4.2 | 0.005324999999999999 | 1.04 | AML | other | m | 2012-05-20T11:00:14.24 |
| SI.BOSI.HHN. | ML:4.3 | 0.007345000000000001 | 0.44 | AML | other | m | 2012-05-20T11:00:16.22 |
| IV.BRIS.HHE. | ML:3.2 | 0.0020549999999999995 | 0.52 | AML | other | m | 2012-05-20T10:59:51.54 |
| IV.BRIS.HNE. | ML:3.6 | 0.00534 | 0.52 | AML | other | m | 2012-05-20T10:59:51.55 |
| IV.BRIS.HHN. | ML:3.0 | 0.00126 | 0.4 | AML | other | m | 2012-05-20T10:59:50.53 |
| IV.BRIS.HNN. | ML:3.3 | 0.0030600000000000002 | 0.42 | AML | other | m | 2012-05-20T10:59:50.53 |
| IV.BRMO.HHN. | ML:3.6 | 0.001445 | 0.74 | AML | other | m | 2012-05-20T11:00:17.18 |
| IV.BRMO.HHE. | ML:3.8 | 0.0019049999999999998 | 0.52 | AML | other | m | 2012-05-20T11:00:17.32 |
| IV.CAFI.HHN. | ML:3.2 | 0.0006005 | 0.74 | AML | other | m | 2012-05-20T10:59:51.72 |
| IV.CAFI.HNN. | ML:3.2 | 0.0005795 | 0.74 | AML | other | m | 2012-05-20T10:59:51.72 |
| IV.CAFI.HHE. | ML:3.2 | 0.000526 | 0.52 | AML | other | m | 2012-05-20T11:00:17.63 |
| IV.CAFI.HNE. | ML:3.1 | 0.000515 | 0.52 | AML | other | m | 2012-05-20T11:00:17.63 |
| IV.CASP.HHN. | ML:2.9 | 0.000177 | 0.92 | AML | other | m | 2012-05-20T11:00:25.14 |
| IV.CASP.HHE. | ML:3.0 | 0.0002205 | 0.42 | AML | other | m | 2012-05-20T11:00:22.93 |
| IV.CELB.HHE. | ML:3.0 | 0.000185 | 0.24 | AML | other | m | 2012-05-20T11:00:25.47 |
| IV.CELB.HHN. | ML:3.2 | 0.0003165 | 0.34 | AML | other | m | 2012-05-20T11:00:26.94 |
| NI.CGRP.HHN. | ML:3.8 | 0.0048000000000000004 | 0.72 | AML | other | m | 2012-05-20T11:00:02.58 |
| NI.CGRP.HHE. | ML:3.8 | 0.004325 | 0.74 | AML | other | m | 2012-05-20T11:00:06.87 |
| IV.CRMI.HHN. | ML:3.1 | 0.0009075 | 0.78 | AML | other | m | 2012-05-20T10:59:59.56 |
| IV.CRMI.HHE. | ML:3.3 | 0.0013399999999999998 | 1.06 | AML | other | m | 2012-05-20T10:59:59.73 |
| IV.CSNT.HHN. | ML:3.2 | 0.0007889999999999999 | 0.6 | AML | other | m | 2012-05-20T11:00:06.71 |
| IV.CSNT.HHE. | ML:3.2 | 0.000803 | 0.7 | AML | other | m | 2012-05-20T11:00:10.24 |
| IV.CTI.HHN. | ML:4.0 | 0.006869999999999999 | 0.82 | AML | other | m | 2012-05-20T11:00:01.01 |
| IV.CTI.HHE. | ML:4.1 | 0.007324999999999999 | 0.64 | AML | other | m | 2012-05-20T11:00:01.20 |
| IV.CTL8.EHN. | ML:3.7 | 0.003545 | 0.52 | AML | other | m | 2012-05-20T11:00:04.20 |
| IV.CTL8.EHE. | ML:3.7 | 0.003345 | 0.36 | AML | other | m | 2012-05-20T11:00:04.36 |
| IV.CTL8.HNE. | ML:4.2 | 0.011425000000000001 | 1.38 | AML | other | m | 2012-05-20T11:00:04.12 |
| IV.CTL8.HNN. | ML:4.2 | 0.011030000000000002 | 0.46 | AML | other | m | 2012-05-20T11:00:03.83 |
| IV.FDMO.HHE. | ML:3.1 | 0.0002585 | 1.54 | AML | other | m | 2012-05-20T11:00:48.98 |
| IV.FDMO.HHN. | ML:3.2 | 0.0002895 | 0.88 | AML | other | m | 2012-05-20T11:00:39.73 |
| GU.FINB.HHE. | ML:3.7 | 0.000961 | 0.32 | AML | other | m | 2012-05-20T11:00:29.35 |
| GU.FINB.HHN. | ML:2.2 | 0.00002885 | 1.02 | AML | other | m | 2012-05-20T11:00:35.34 |
| IV.FIU.EHE. | ML:3.7 | 0.02445 | 1.34 | AML | other | m | 2012-05-20T10:59:38.78 |
| IV.FIU.EHN. | ML:3.8 | 0.03605 | 1.58 | AML | other | m | 2012-05-20T10:59:38.57 |
| IV.FSSB.HHN. | ML:3.6 | 0.00164 | 0.48 | AML | other | m | 2012-05-20T11:00:25.29 |
| IV.FSSB.HHE. | ML:3.7 | 0.00203 | 0.56 | AML | other | m | 2012-05-20T11:00:23.47 |
| RF.GEPF.HHE. | ML:3.4 | 0.000689 | 0.78 | AML | other | m | 2012-05-20T11:00:31.66 |
| RF.GEPF.HHN. | ML:3.5 | 0.0008655 | 0.66 | AML | other | m | 2012-05-20T11:00:29.99 |
| IV.GROG.HHE. | ML:3.5 | 0.0010500000000000002 | 0.58 | AML | other | m | 2012-05-20T11:00:23.00 |
| IV.GROG.HHN. | ML:3.4 | 0.000725 | 0.6 | AML | other | m | 2012-05-20T11:00:23.31 |
| IV.IMOL.HNN. | ML:3.5 | 0.00609 | 0.96 | AML | other | m | 2012-05-20T10:59:49.37 |
| IV.IMOL.HNE. | ML:3.4 | 0.004144999999999999 | 1.08 | AML | other | m | 2012-05-20T10:59:58.36 |
| SI.KOSI.HHN. | ML:4.0 | 0.00337 | 0.62 | AML | other | m | 2012-05-20T11:00:15.10 |
| SI.KOSI.HHE. | ML:4.1 | 0.00452 | 0.94 | AML | other | m | 2012-05-20T11:00:12.27 |
| IV.MABI.HHE. | ML:3.5 | 0.00156 | 0.52 | AML | other | m | 2012-05-20T11:00:03.79 |
| IV.MABI.HHN. | ML:3.5 | 0.00188 | 0.7 | AML | other | m | 2012-05-20T11:00:03.99 |
| GU.MAIM.HHE. | ML:3.4 | 0.001765 | 0.56 | AML | other | m | 2012-05-20T11:00:08.44 |
| GU.MAIM.HHN. | ML:3.7 | 0.003335 | 0.58 | AML | other | m | 2012-05-20T11:00:09.24 |
| IV.MGAB.HNE. | ML:3.4 | 0.0005135 | 0.52 | AML | other | m | 2012-05-20T11:00:07.84 |
| IV.MGAB.HNN. | ML:3.3 | 0.00045499999999999995 | 0.72 | AML | other | m | 2012-05-20T11:00:34.67 |
| IV.MGAB.HHN. | ML:3.3 | 0.000447 | 0.76 | AML | other | m | 2012-05-20T11:00:42.74 |
| IV.MGAB.HHE. | ML:3.4 | 0.0005315 | 0.52 | AML | other | m | 2012-05-20T11:00:07.84 |
| IV.MNTV.HNE. | ML:3.6 | 0.010780000000000001 | 0.66 | AML | other | m | 2012-05-20T11:00:14.03 |
| IV.MNTV.HNN. | ML:3.6 | 0.010405000000000001 | 0.78 | AML | other | m | 2012-05-20T11:00:05.05 |
| IV.MONC.HHN. | ML:3.6 | 0.0006365 | 0.34 | AML | other | m | 2012-05-20T11:00:42.10 |
| IV.MONC.HHE. | ML:3.7 | 0.0007765 | 0.7 | AML | other | m | 2012-05-20T11:01:07.32 |
| SI.MOSI.HHE. | ML:4.1 | 0.0037649999999999997 | 0.7 | AML | other | m | 2012-05-20T11:00:22.00 |
| SI.MOSI.HHN. | ML:4.3 | 0.005804999999999999 | 0.86 | AML | other | m | 2012-05-20T11:00:19.93 |
| IV.MPAG.EHN. | ML:3.4 | 0.0008615 | 0.7 | AML | other | m | 2012-05-20T11:00:30.30 |
| IV.MPAG.EHE. | ML:3.3 | 0.000787 | 0.5 | AML | other | m | 2012-05-20T11:00:19.77 |
| IV.MSSA.HHE. | ML:3.4 | 0.0010815000000000002 | 1.58 | AML | other | m | 2012-05-20T11:00:17.22 |
| IV.MSSA.HHN. | ML:3.7 | 0.002545 | 0.68 | AML | other | m | 2012-05-20T11:00:17.46 |
| IV.MTRZ.HHE. | ML:3.5 | 0.00661 | 1.08 | AML | other | m | 2012-05-20T10:59:46.54 |
| IV.MTRZ.HNE. | ML:3.5 | 0.006395 | 1.1 | AML | other | m | 2012-05-20T10:59:46.54 |
| IV.MTRZ.HHN. | ML:3.5 | 0.005560000000000001 | 0.6 | AML | other | m | 2012-05-20T11:00:05.22 |
| IV.MTRZ.HNN. | ML:3.4 | 0.005449999999999999 | 0.6 | AML | other | m | 2012-05-20T11:00:05.22 |
| IV.NARO.HHN. | ML:3.1 | 0.000502 | 0.92 | AML | other | m | 2012-05-20T11:00:24.48 |
| IV.NARO.HHE. | ML:3.1 | 0.0004805 | 0.78 | AML | other | m | 2012-05-20T11:00:24.06 |
| IV.NOVE.EHE. | ML:3.4 | 0.00732 | 0.5 | AML | other | m | 2012-05-20T10:59:39.01 |
| IV.NOVE.EHN. | ML:3.4 | 0.006435000000000001 | 0.68 | AML | other | m | 2012-05-20T10:59:38.36 |
| IV.OPPE.HNE. | ML:3.6 | 0.010465 | 0.48 | AML | other | m | 2012-05-20T10:59:38.05 |
| IV.OPPE.HNN. | ML:3.8 | 0.016649999999999998 | 0.5 | AML | other | m | 2012-05-20T10:59:38.28 |
| IV.PARC.HHN. | ML:3.2 | 0.000825 | 1.54 | AML | other | m | 2012-05-20T11:00:19.94 |
| IV.PARC.HHE. | ML:3.0 | 0.000533 | 0.8 | AML | other | m | 2012-05-20T11:00:13.54 |
| GU.PCP.HHE. | ML:3.2 | 0.0003755 | 1.28 | AML | other | m | 2012-05-20T11:00:29.11 |
| GU.PCP.HHN. | ML:3.4 | 0.00065 | 0.5 | AML | other | m | 2012-05-20T11:00:26.78 |
| IV.PESA.HHN. | ML:3.5 | 0.0016 | 0.88 | AML | other | m | 2012-05-20T11:00:08.97 |
| IV.PESA.HHE. | ML:3.5 | 0.001365 | 1.02 | AML | other | m | 2012-05-20T11:00:15.07 |
| IV.PIEI.HHE. | ML:3.3 | 0.0006969999999999999 | 0.86 | AML | other | m | 2012-05-20T11:00:22.28 |
| IV.PIEI.HHN. | ML:3.1 | 0.000491 | 0.52 | AML | other | m | 2012-05-20T11:00:19.03 |
| IV.PLMA.HHN. | ML:3.5 | 0.00173 | 0.58 | AML | other | m | 2012-05-20T11:00:06.83 |
| IV.PLMA.HHE. | ML:3.4 | 0.00121 | 0.64 | AML | other | m | 2012-05-20T11:00:12.62 |
| NI.POLC.HHE. | ML:3.7 | 0.002265 | 0.54 | AML | other | m | 2012-05-20T11:00:09.95 |
| NI.POLC.HHN. | ML:4.0 | 0.004395 | 0.52 | AML | other | m | 2012-05-20T11:00:15.53 |
| GU.POPM.HHN. | ML:3.6 | 0.00362 | 0.98 | AML | other | m | 2012-05-20T10:59:55.94 |
| GU.POPM.HHE. | ML:3.4 | 0.0024100000000000002 | 1.26 | AML | other | m | 2012-05-20T10:59:56.95 |
| IV.PRMA.HHE. | ML:3.3 | 0.00249 | 0.94 | AML | other | m | 2012-05-20T10:59:54.51 |
| IV.PRMA.HHN. | ML:3.3 | 0.002515 | 1.06 | AML | other | m | 2012-05-20T10:59:51.98 |
| IV.QLNO.HHE. | ML:3.2 | 0.0002935 | 0.58 | AML | other | m | 2012-05-20T11:00:32.69 |
| IV.QLNO.HHN. | ML:3.1 | 0.00022849999999999997 | 1.14 | AML | other | m | 2012-05-20T11:00:34.26 |
| IV.RAVA.EHN. | ML:4.6 | 0.274 | 0.2 | AML | other | m | 2012-05-20T10:59:28.57 |
| IV.RAVA.EHE. | ML:4.3 | 0.1515 | 0.28 | AML | other | m | 2012-05-20T10:59:28.92 |
| SI.RISI.HHN. | ML:4.0 | 0.0019649999999999997 | 0.98 | AML | other | m | 2012-05-20T11:00:39.16 |
| SI.RISI.HHE. | ML:4.2 | 0.002975 | 0.48 | AML | other | m | 2012-05-20T11:00:39.14 |
| GU.RORO.HHE. | ML:3.0 | 0.00016 | 0.76 | AML | other | m | 2012-05-20T11:00:45.64 |
| GU.RORO.HHN. | ML:2.9 | 0.00013450000000000002 | 0.94 | AML | other | m | 2012-05-20T11:00:35.00 |
| SI.ROSI.HHE. | ML:3.9 | 0.001735 | 0.98 | AML | other | m | 2012-05-20T11:00:28.04 |
| SI.ROSI.HHN. | ML:3.9 | 0.001865 | 0.58 | AML | other | m | 2012-05-20T11:00:29.99 |
| IV.ROVR.HHE. | ML:3.9 | 0.009179999999999999 | 0.38 | AML | other | m | 2012-05-20T10:59:50.08 |
| IV.ROVR.HHN. | ML:4.1 | 0.014350000000000002 | 1 | AML | other | m | 2012-05-20T10:59:50.33 |
| IV.SALO.HHN. | ML:3.9 | 0.0076500000000000005 | 1.1 | AML | other | m | 2012-05-20T10:59:55.47 |
| IV.SALO.HHE. | ML:4.0 | 0.00837 | 0.76 | AML | other | m | 2012-05-20T10:59:54.80 |
| IV.SERM.EHN. | ML:3.4 | 0.023399999999999997 | 0.42 | AML | other | m | 2012-05-20T10:59:28.49 |
| IV.SERM.EHE. | ML:3.2 | 0.01515 | 0.52 | AML | other | m | 2012-05-20T10:59:37.67 |
| IV.SFI.EHE. | ML:3.3 | 0.0016899999999999999 | 1.22 | AML | other | m | 2012-05-20T10:59:57.34 |
| IV.SFI.HNN. | ML:3.6 | 0.002825 | 1.36 | AML | other | m | 2012-05-20T10:59:58.21 |
| IV.SFI.EHN. | ML:3.6 | 0.00298 | 1.36 | AML | other | m | 2012-05-20T10:59:58.22 |
| IV.SFI.HNE. | ML:3.3 | 0.001615 | 1.22 | AML | other | m | 2012-05-20T10:59:57.33 |
| IV.SMA1.EHE. | ML:3.5 | 0.0004235 | 0.68 | AML | other | m | 2012-05-20T11:01:06.63 |
| IV.SMA1.EHN. | ML:3.5 | 0.00040849999999999995 | 0.8 | AML | other | m | 2012-05-20T11:01:09.97 |
| IV.SSP9.EHN. | ML:3.3 | 0.0009649999999999999 | 1.56 | AML | other | m | 2012-05-20T11:00:16.76 |
| IV.SSP9.EHE. | ML:3.2 | 0.000815 | 1.58 | AML | other | m | 2012-05-20T11:00:11.40 |
| IV.STAL.HHE. | ML:3.8 | 0.0020549999999999995 | 0.36 | AML | other | m | 2012-05-20T11:00:17.97 |
| IV.STAL.HNE. | ML:3.7 | 0.0017250000000000002 | 0.32 | AML | other | m | 2012-05-20T11:00:18.00 |
| IV.STAL.HHN. | ML:3.5 | 0.001149 | 0.68 | AML | other | m | 2012-05-20T11:00:17.83 |
| IV.STAL.HNN. | ML:3.6 | 0.001415 | 0.28 | AML | other | m | 2012-05-20T11:00:17.83 |
| IV.TEOL.HHE. | ML:3.8 | 0.01315 | 0.44 | AML | other | m | 2012-05-20T10:59:43.01 |
| IV.TEOL.HHN. | ML:3.8 | 0.011940000000000001 | 0.6 | AML | other | m | 2012-05-20T10:59:45.90 |
| IV.TRIF.HHE. | ML:3.0 | 0.000323 | 1.02 | AML | other | m | 2012-05-20T11:00:00.66 |
| IV.TRIF.HHN. | ML:3.0 | 0.00032250000000000003 | 0.68 | AML | other | m | 2012-05-20T11:00:02.38 |
| MN.TUE.HHE. | ML:3.7 | 0.0009869999999999998 | 0.48 | AML | other | m | 2012-05-20T11:00:29.25 |
| MN.TUE.HHN. | ML:3.5 | 0.0007379999999999999 | 0.46 | AML | other | m | 2012-05-20T11:00:30.88 |
| IV.VARE.HHE. | ML:3.2 | 0.0003915 | 0.42 | AML | other | m | 2012-05-20T11:00:27.12 |
| IV.VARE.HHN. | ML:3.6 | 0.0009339999999999999 | 1.28 | AML | other | m | 2012-05-20T11:00:34.30 |
| NI.VINO.HHN. | ML:3.6 | 0.0009235 | 0.56 | AML | other | m | 2012-05-20T11:00:37.96 |
| NI.VINO.HHE. | ML:3.4 | 0.0005795 | 0.92 | AML | other | m | 2012-05-20T11:00:29.76 |
| MN.VLC.HHN. | ML:3.1 | 0.0011799999999999998 | 0.66 | AML | other | m | 2012-05-20T10:59:58.29 |
| MN.VLC.HHE. | ML:3.2 | 0.001555 | 0.64 | AML | other | m | 2012-05-20T10:59:57.07 |
| IV.ZCCA.HNE. | ML:3.4 | 0.004335 | 0.5 | AML | other | m | 2012-05-20T10:59:44.16 |
| IV.ZCCA.HHE. | ML:3.4 | 0.004565 | 0.5 | AML | other | m | 2012-05-20T10:59:44.15 |
| IV.ZCCA.HHN. | ML:3.4 | 0.0041400000000000005 | 0.56 | AML | other | m | 2012-05-20T10:59:52.13 |
| IV.ZCCA.HNN. | ML:3.4 | 0.00424 | 0.56 | AML | other | m | 2012-05-20T10:59:52.14 |